


Century 21 People’s Choice Realty Inc., Brokerage
120 MATHESON BLVD E #103
MISSISSAUGA, Ontario
L4Z 1X1
Kitchener, N2C 1M4
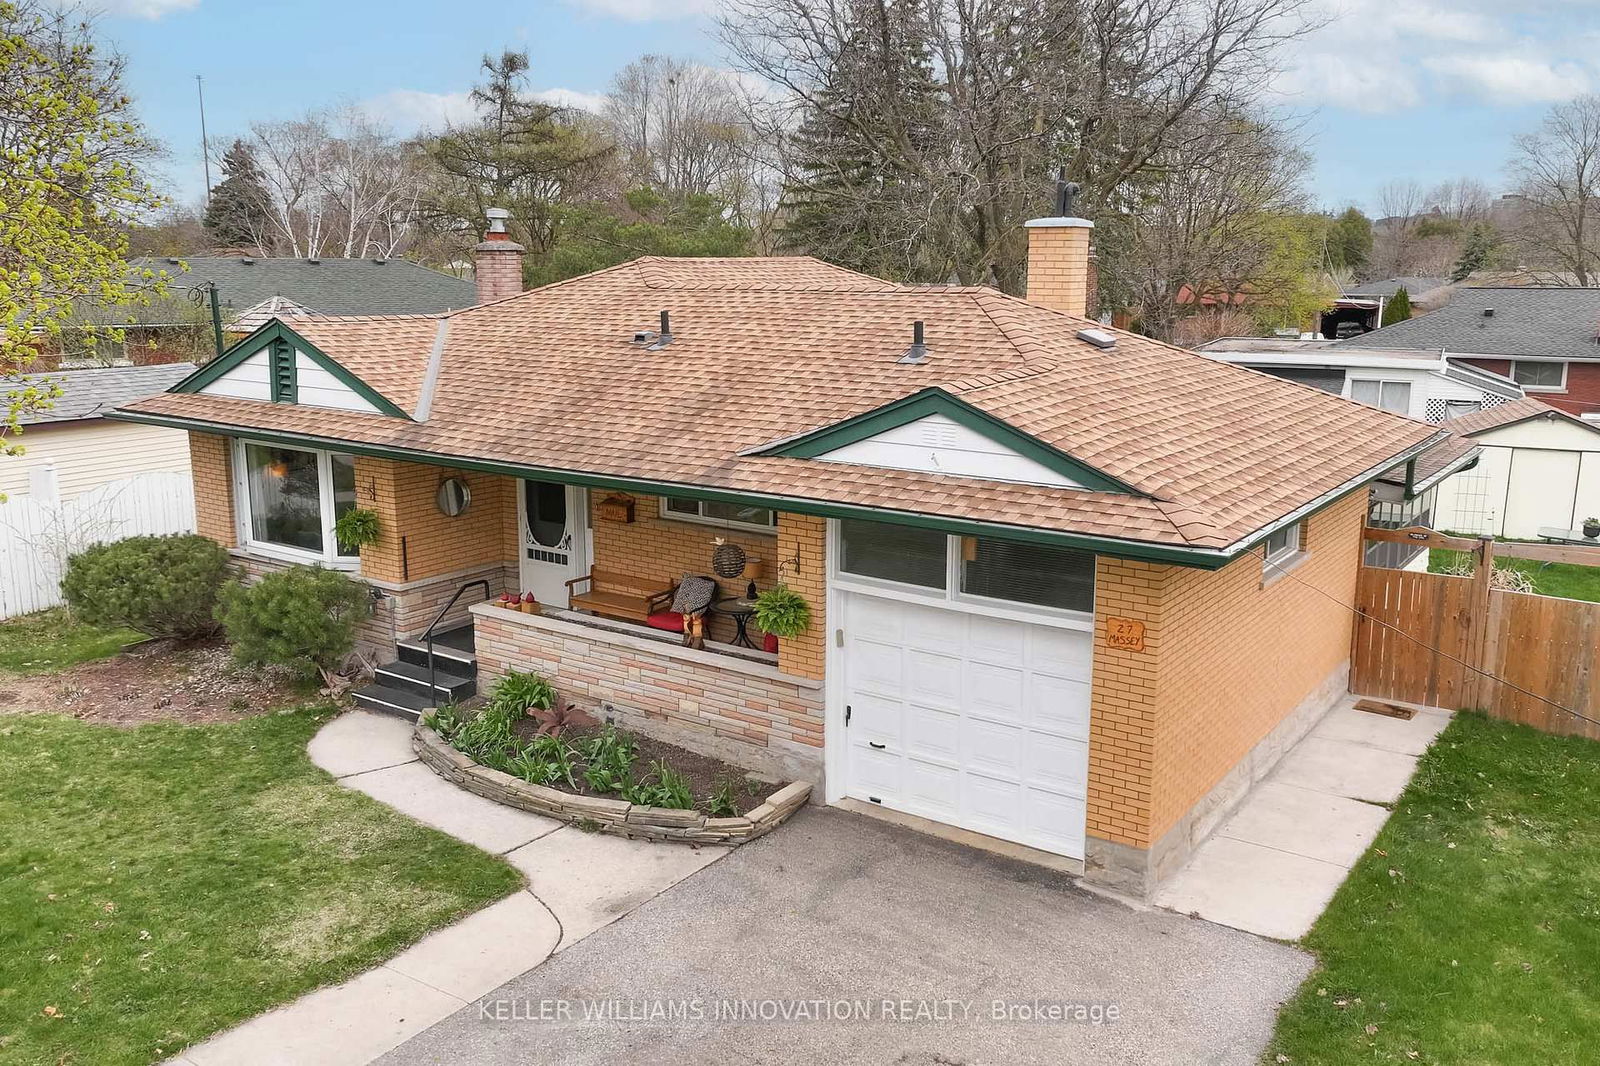
$650,000
Listed by KELLER WILLIAMS INNOVATION REALTY.
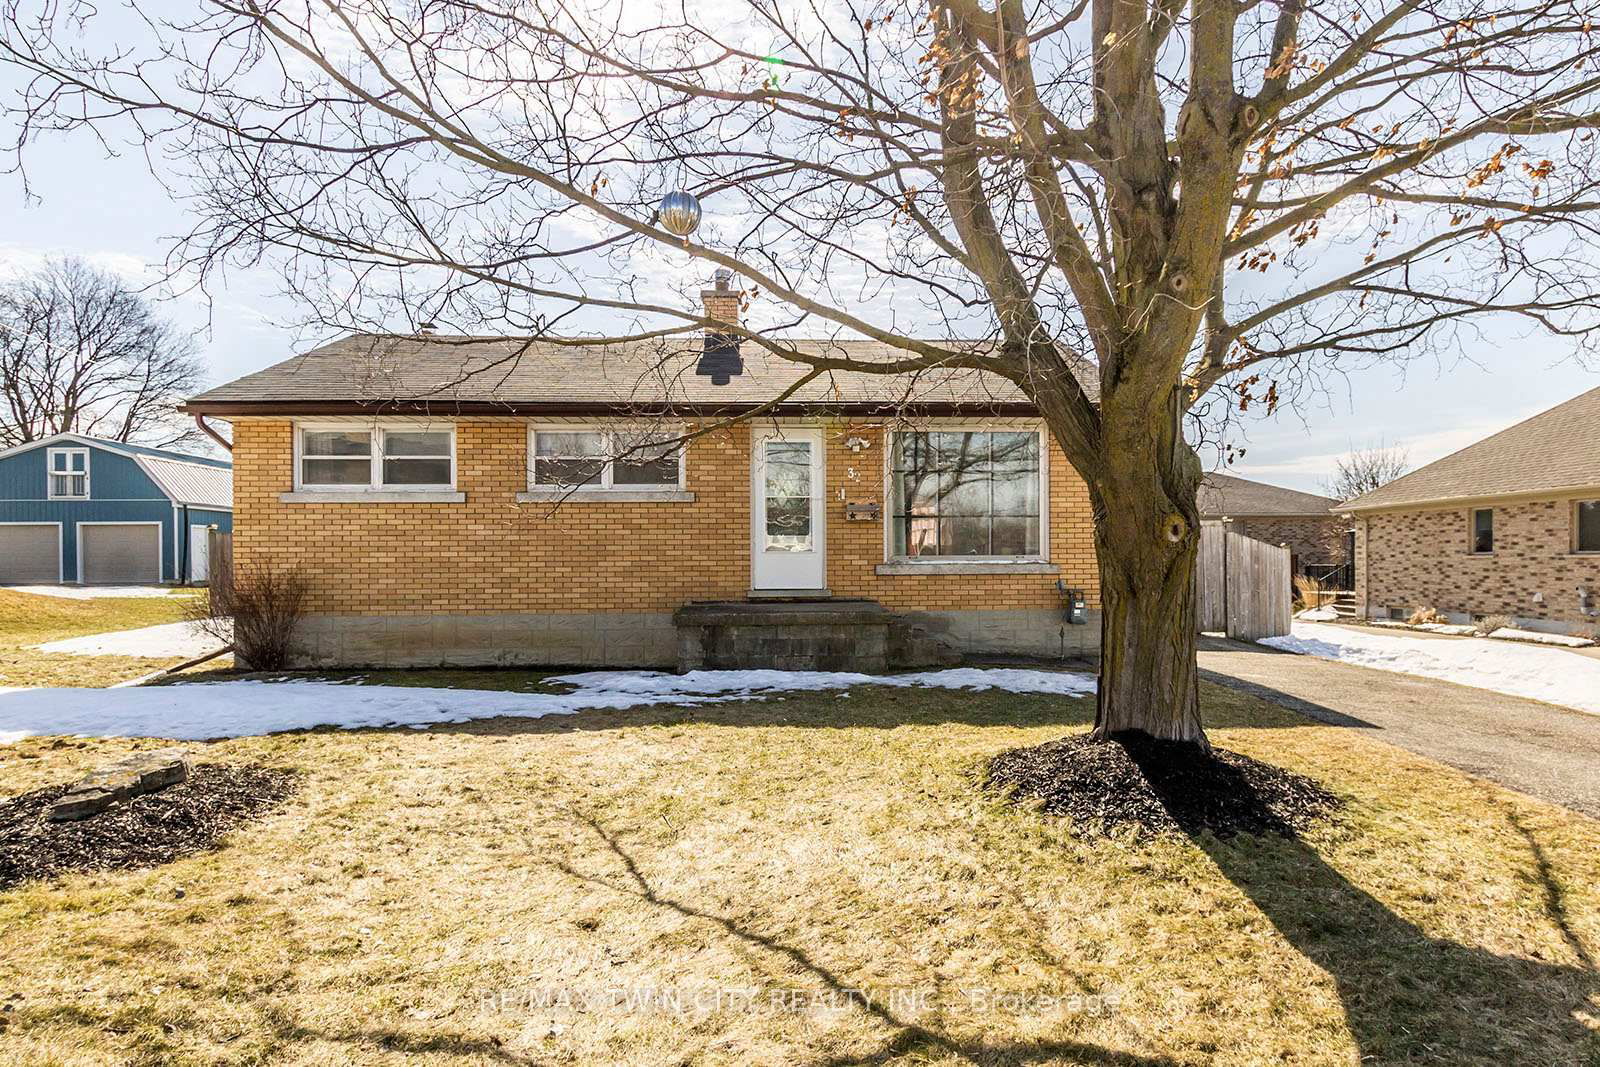
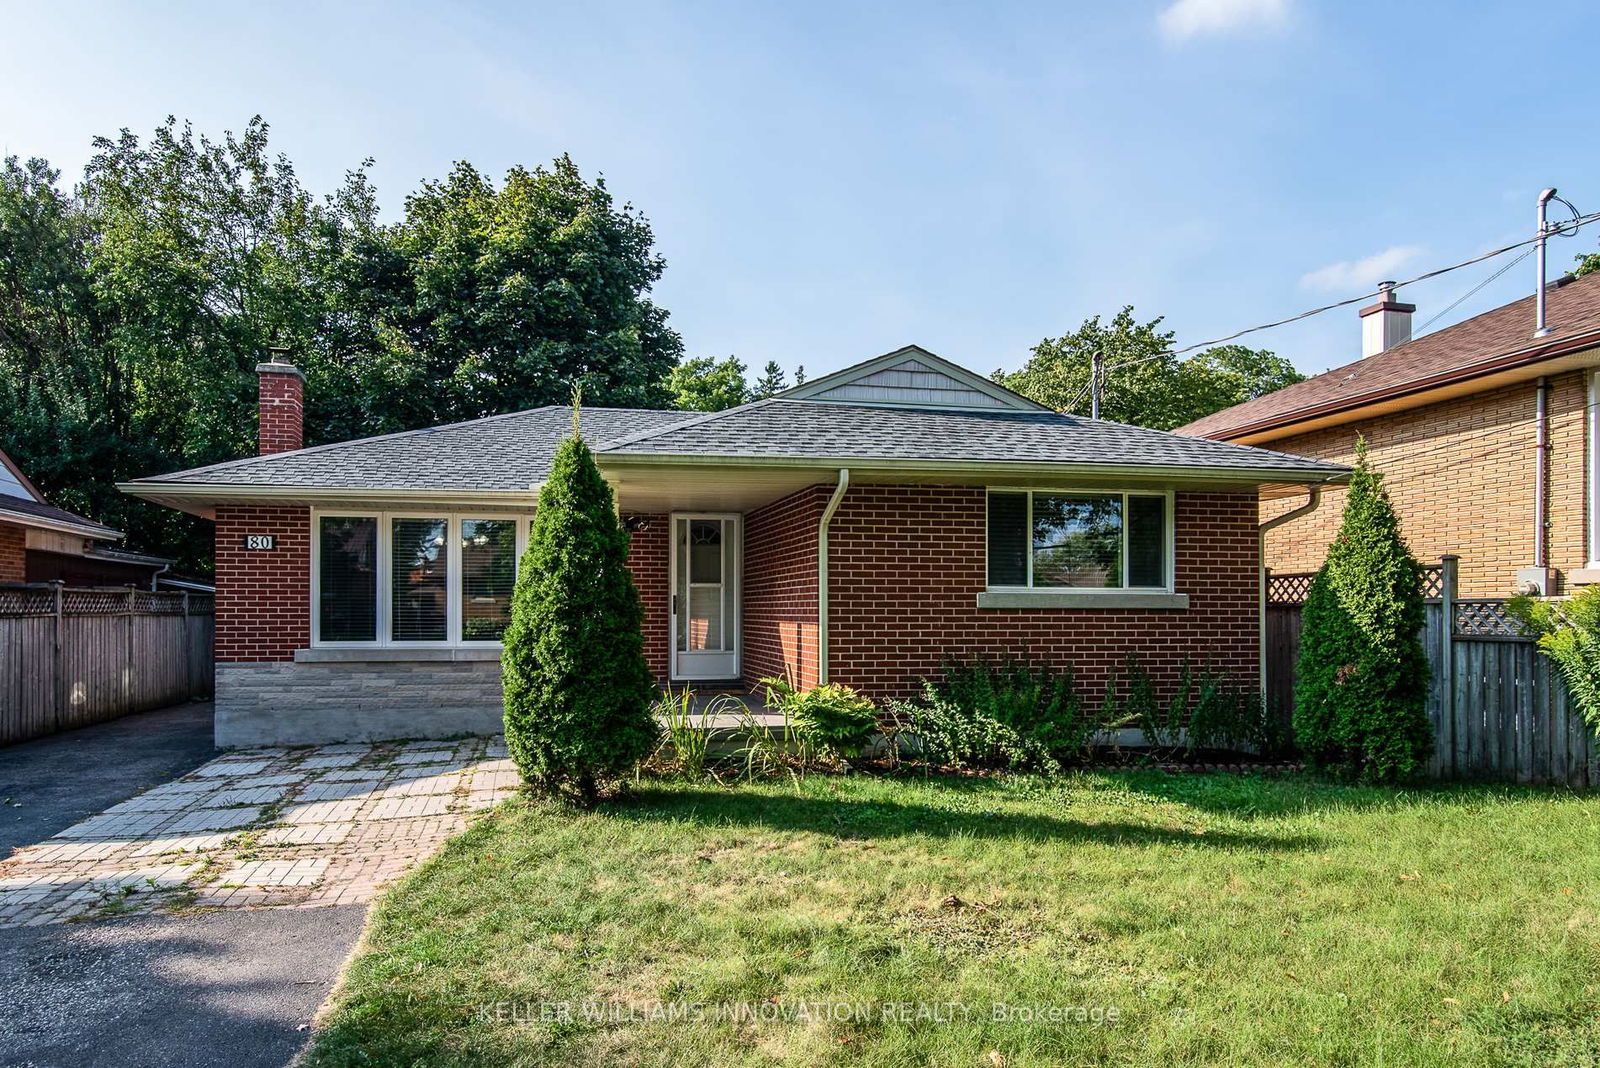
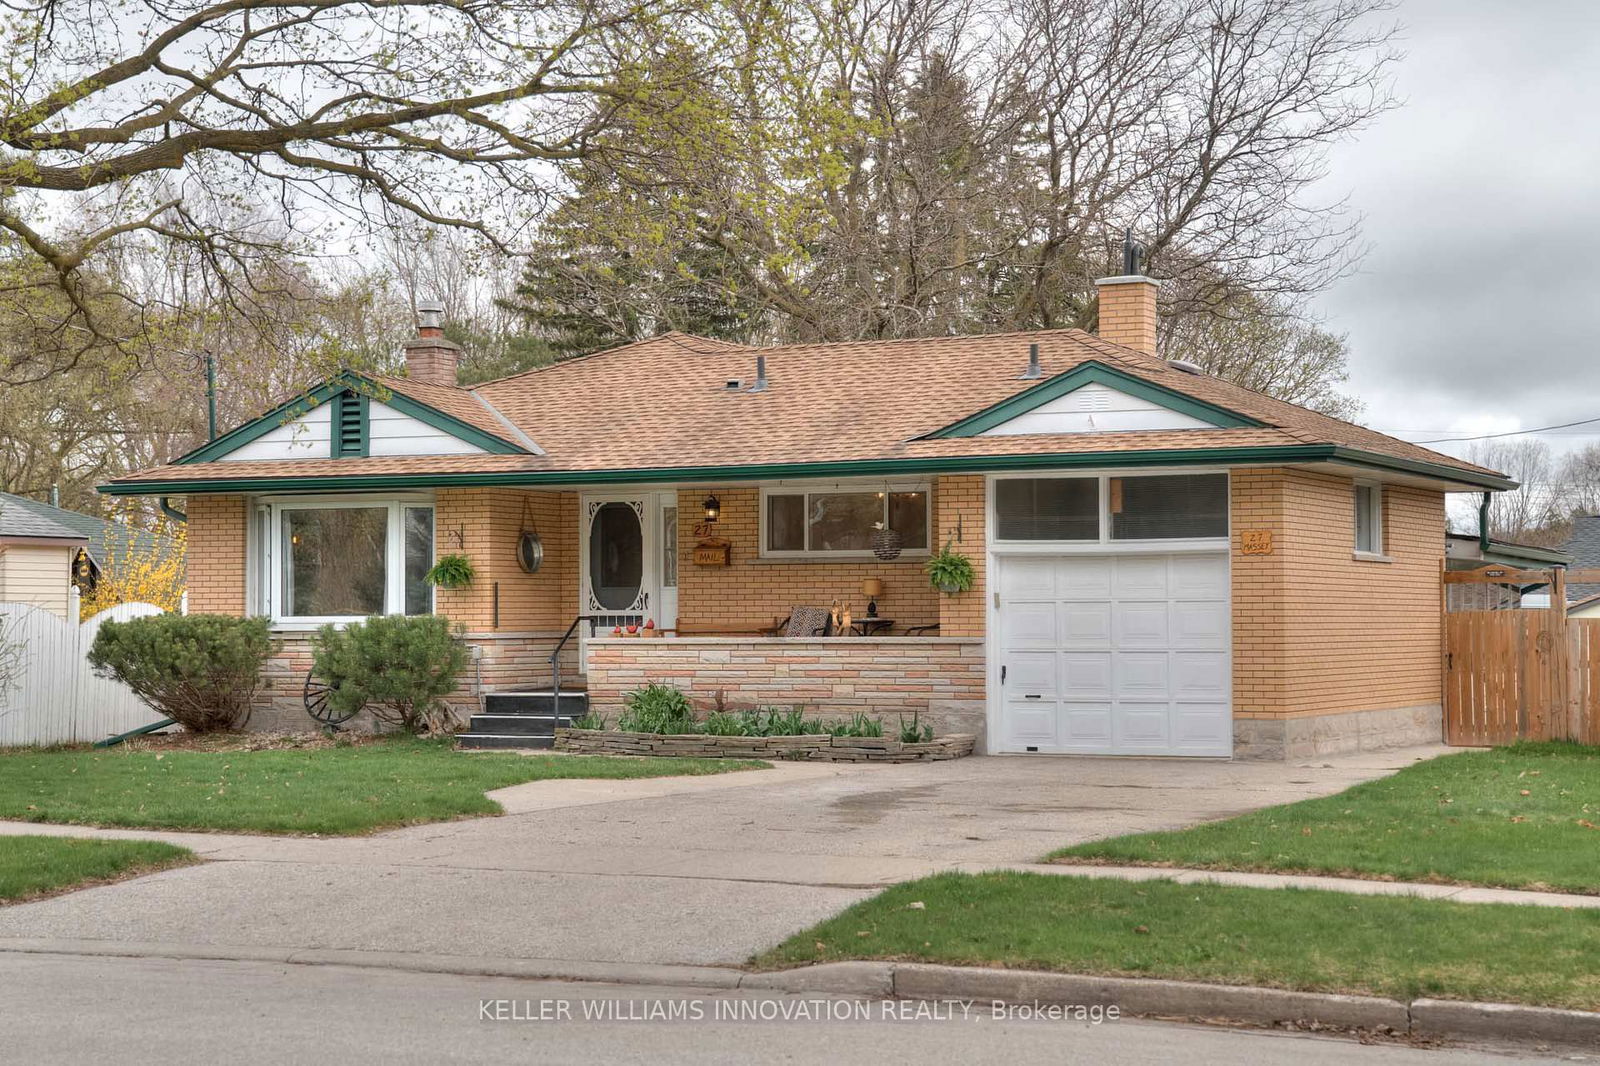
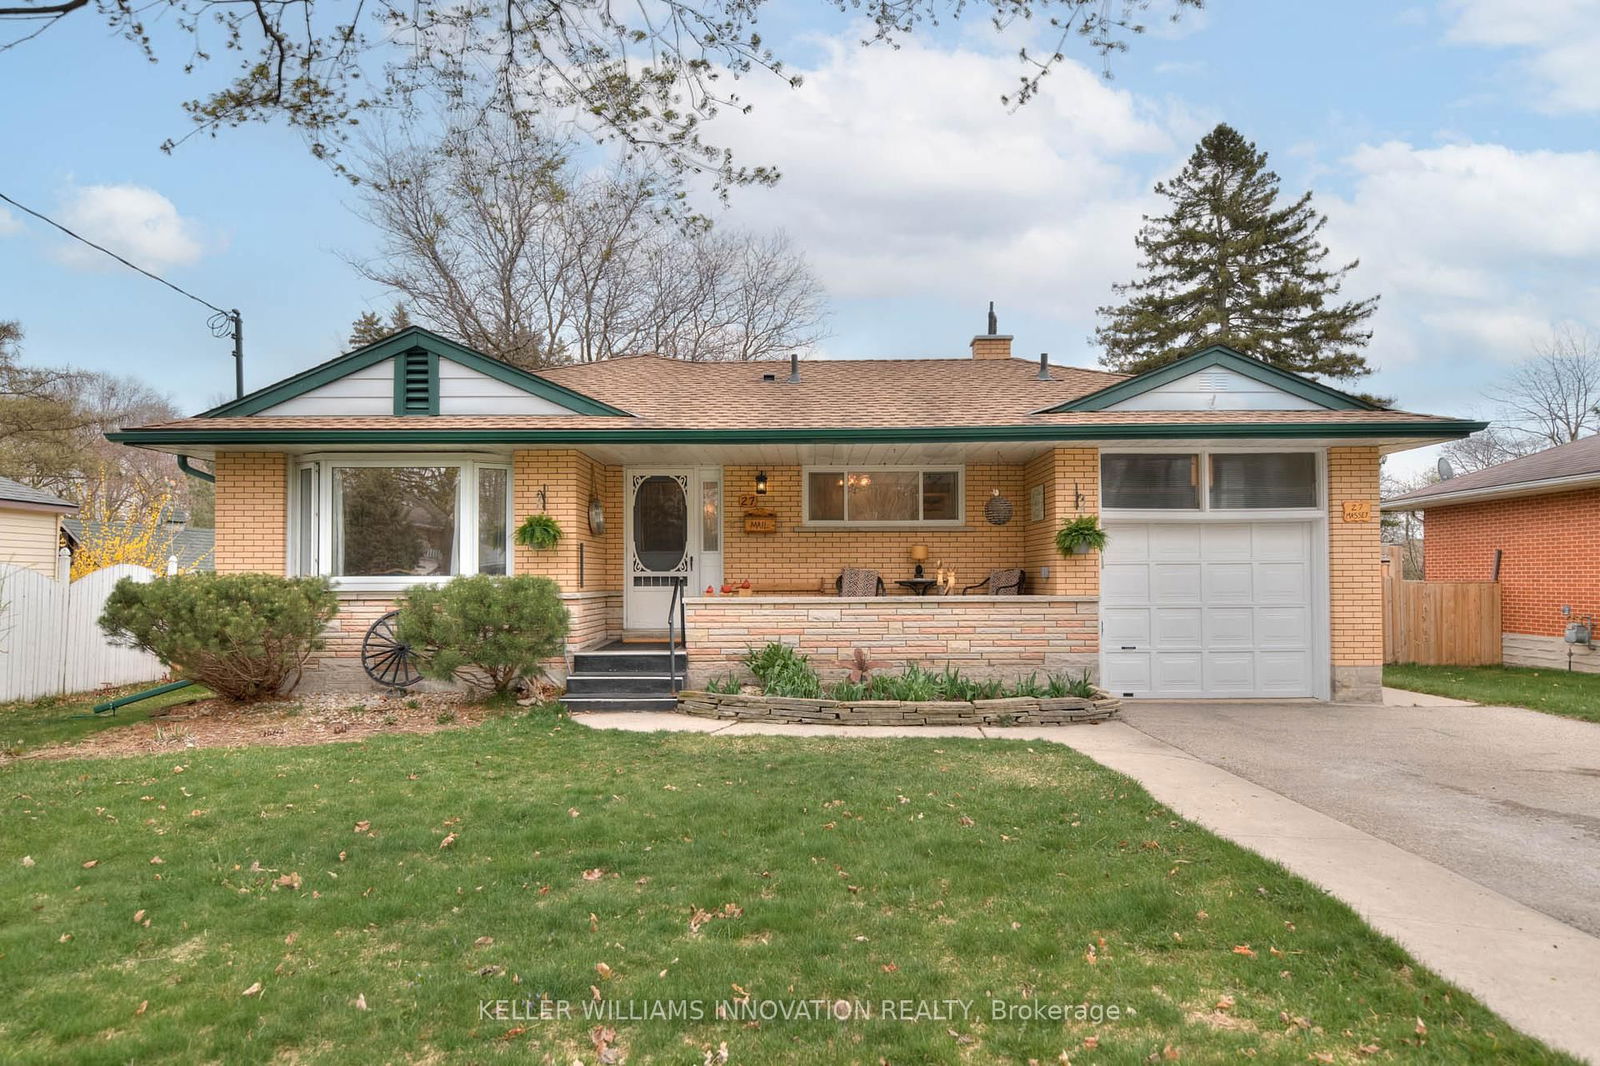
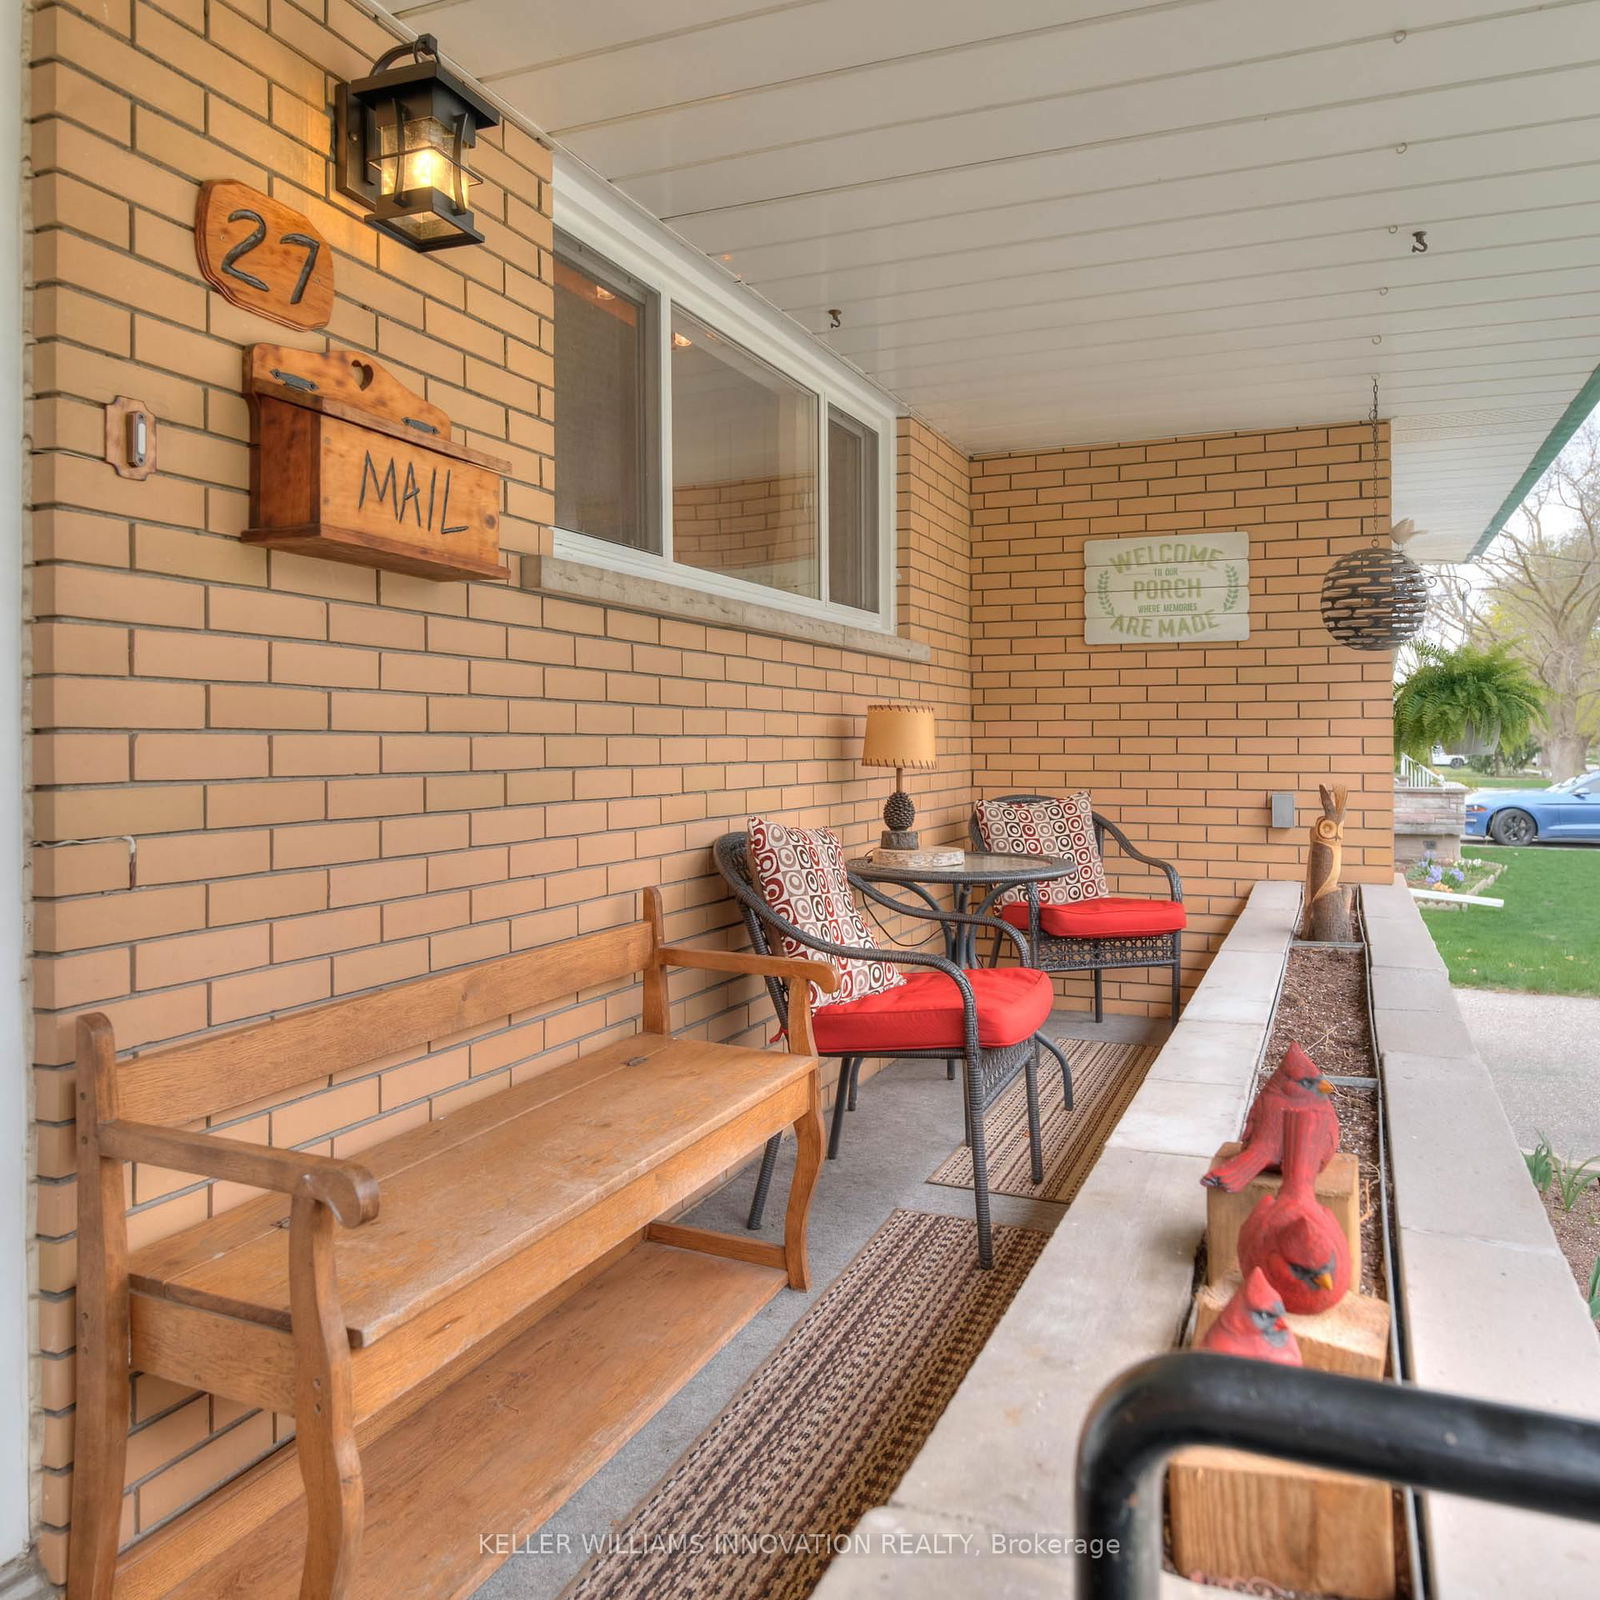
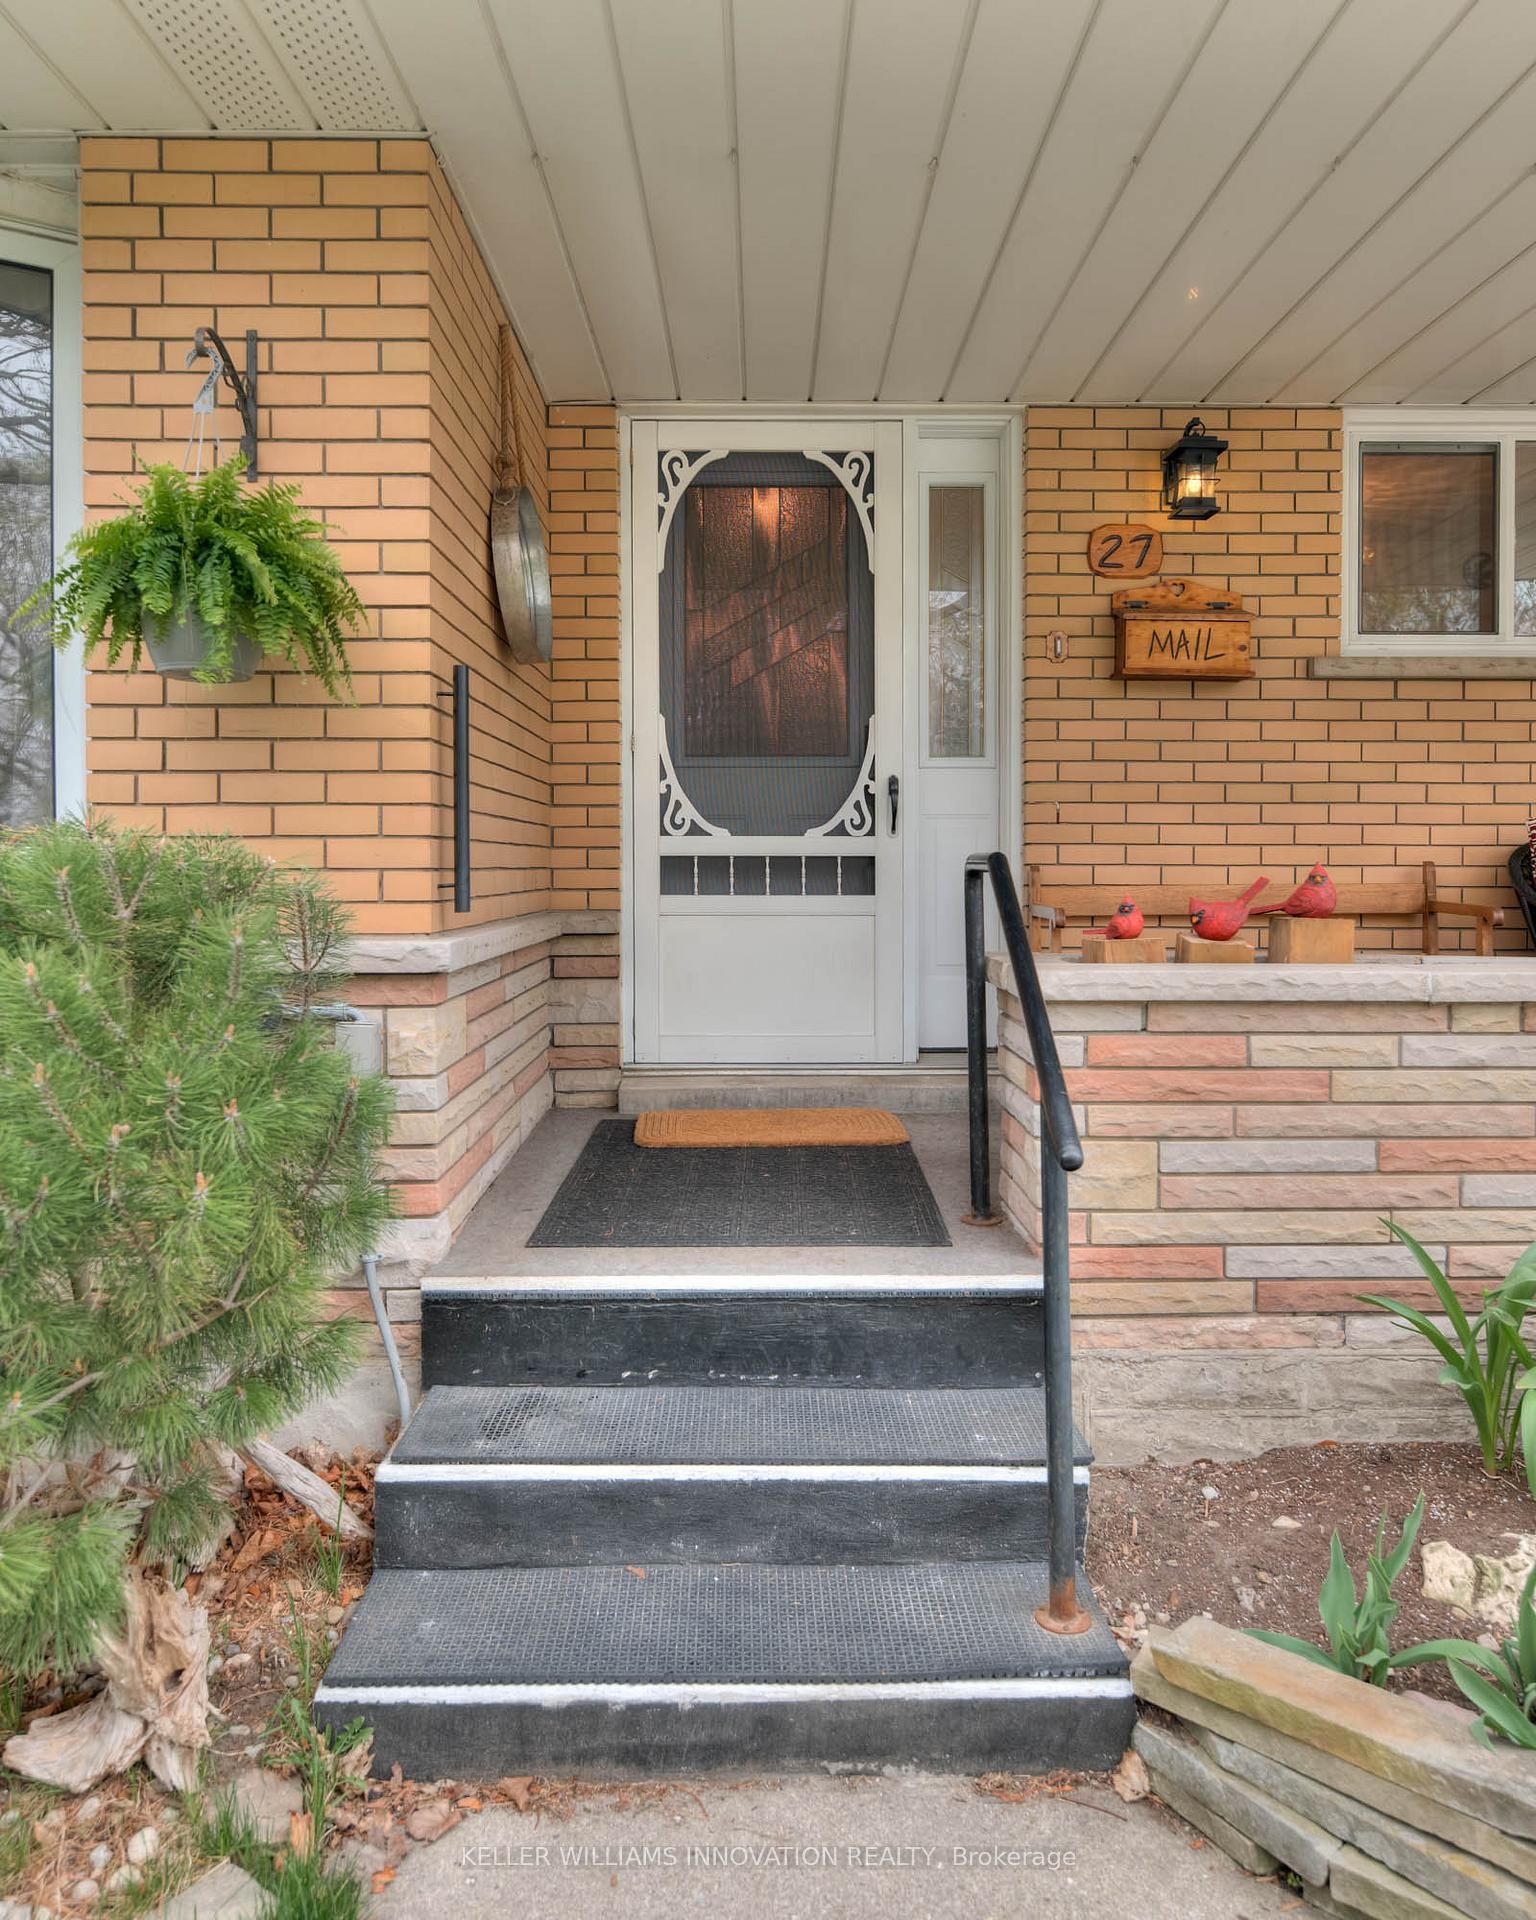
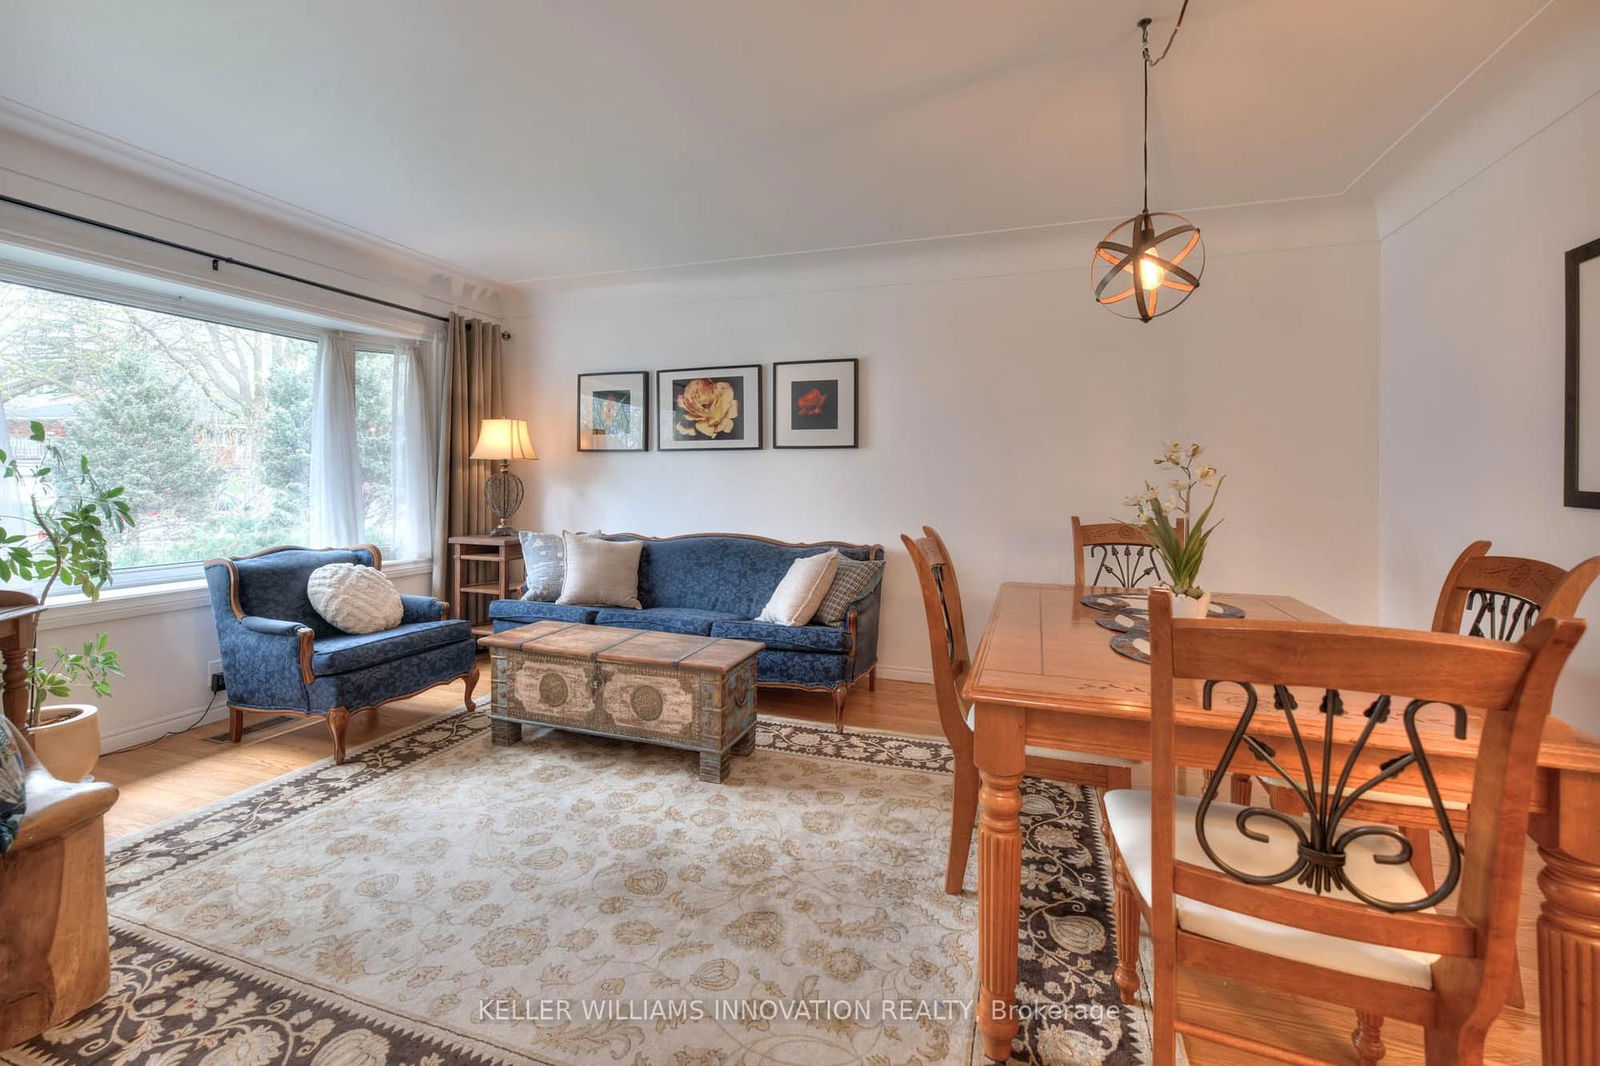
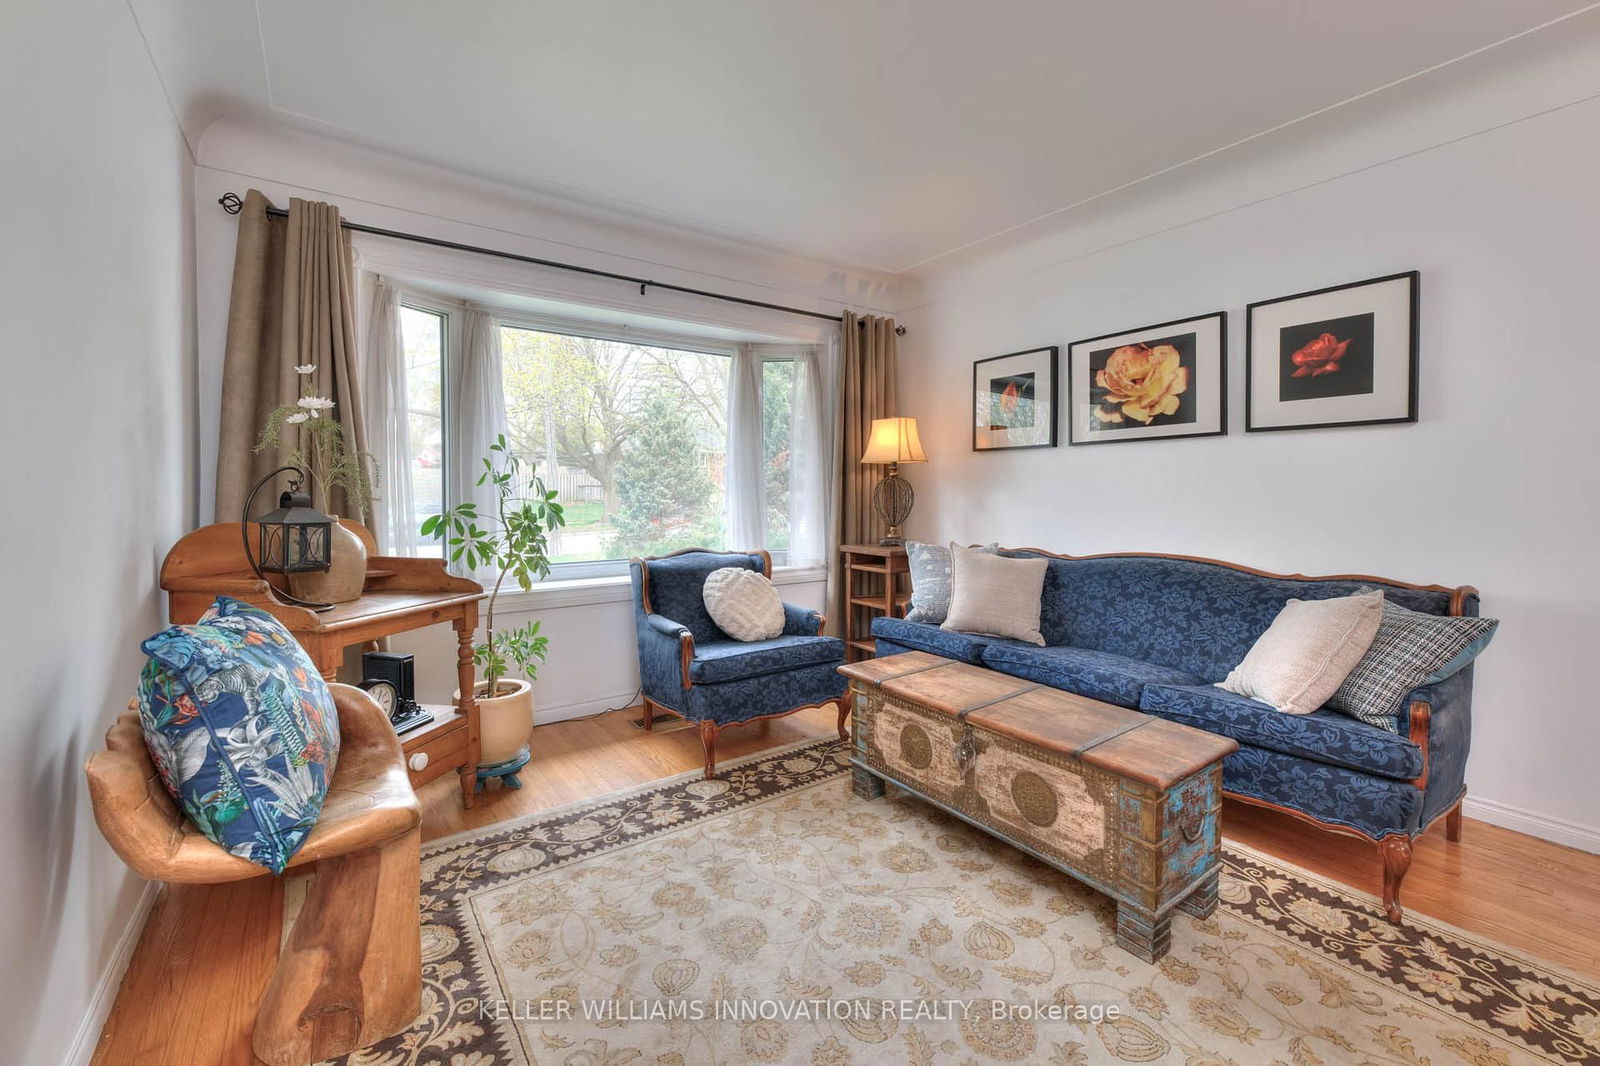
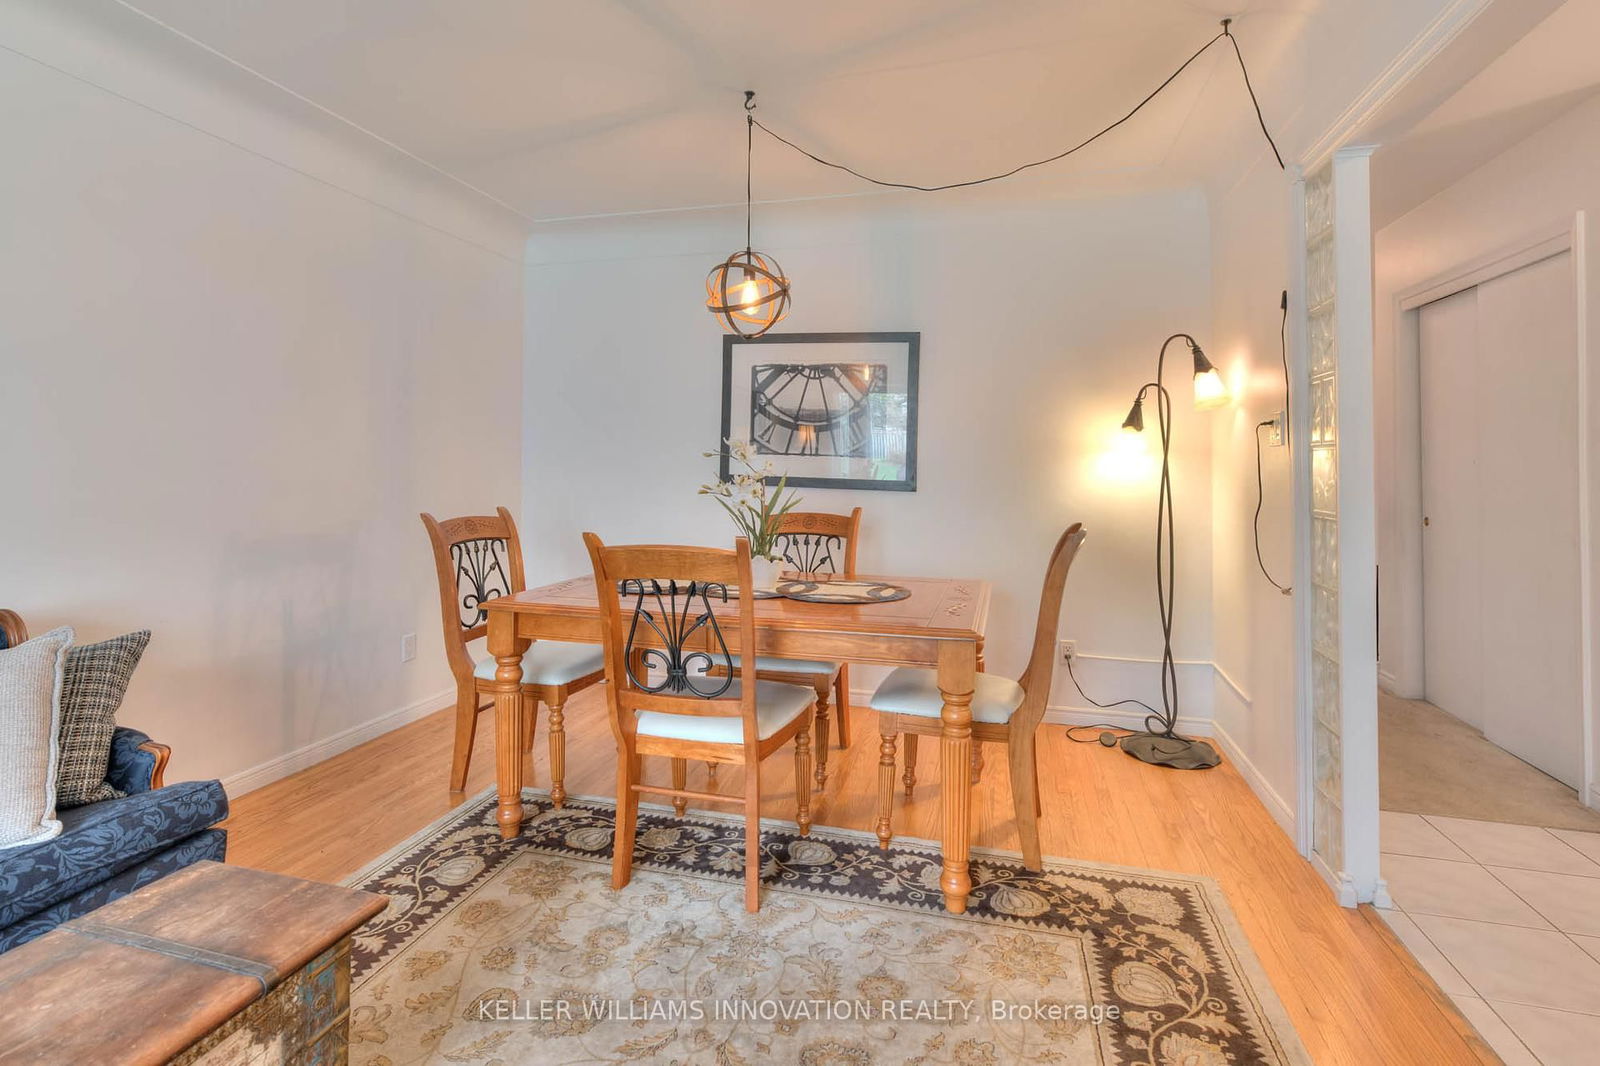
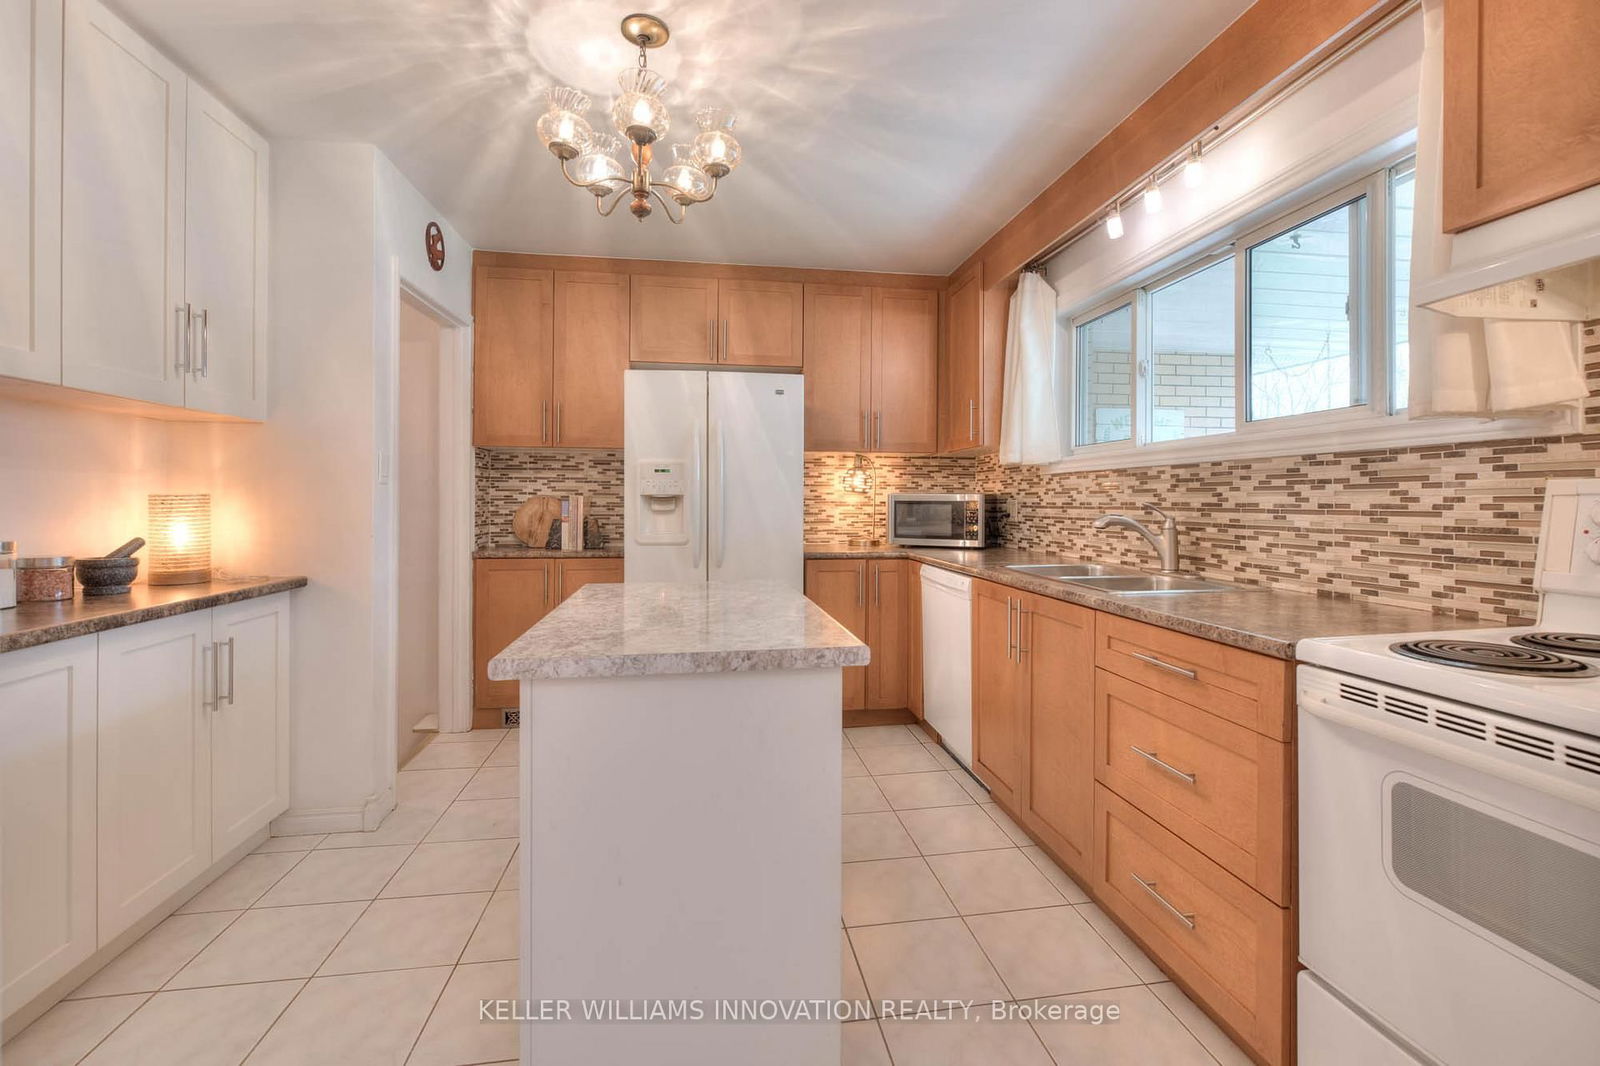
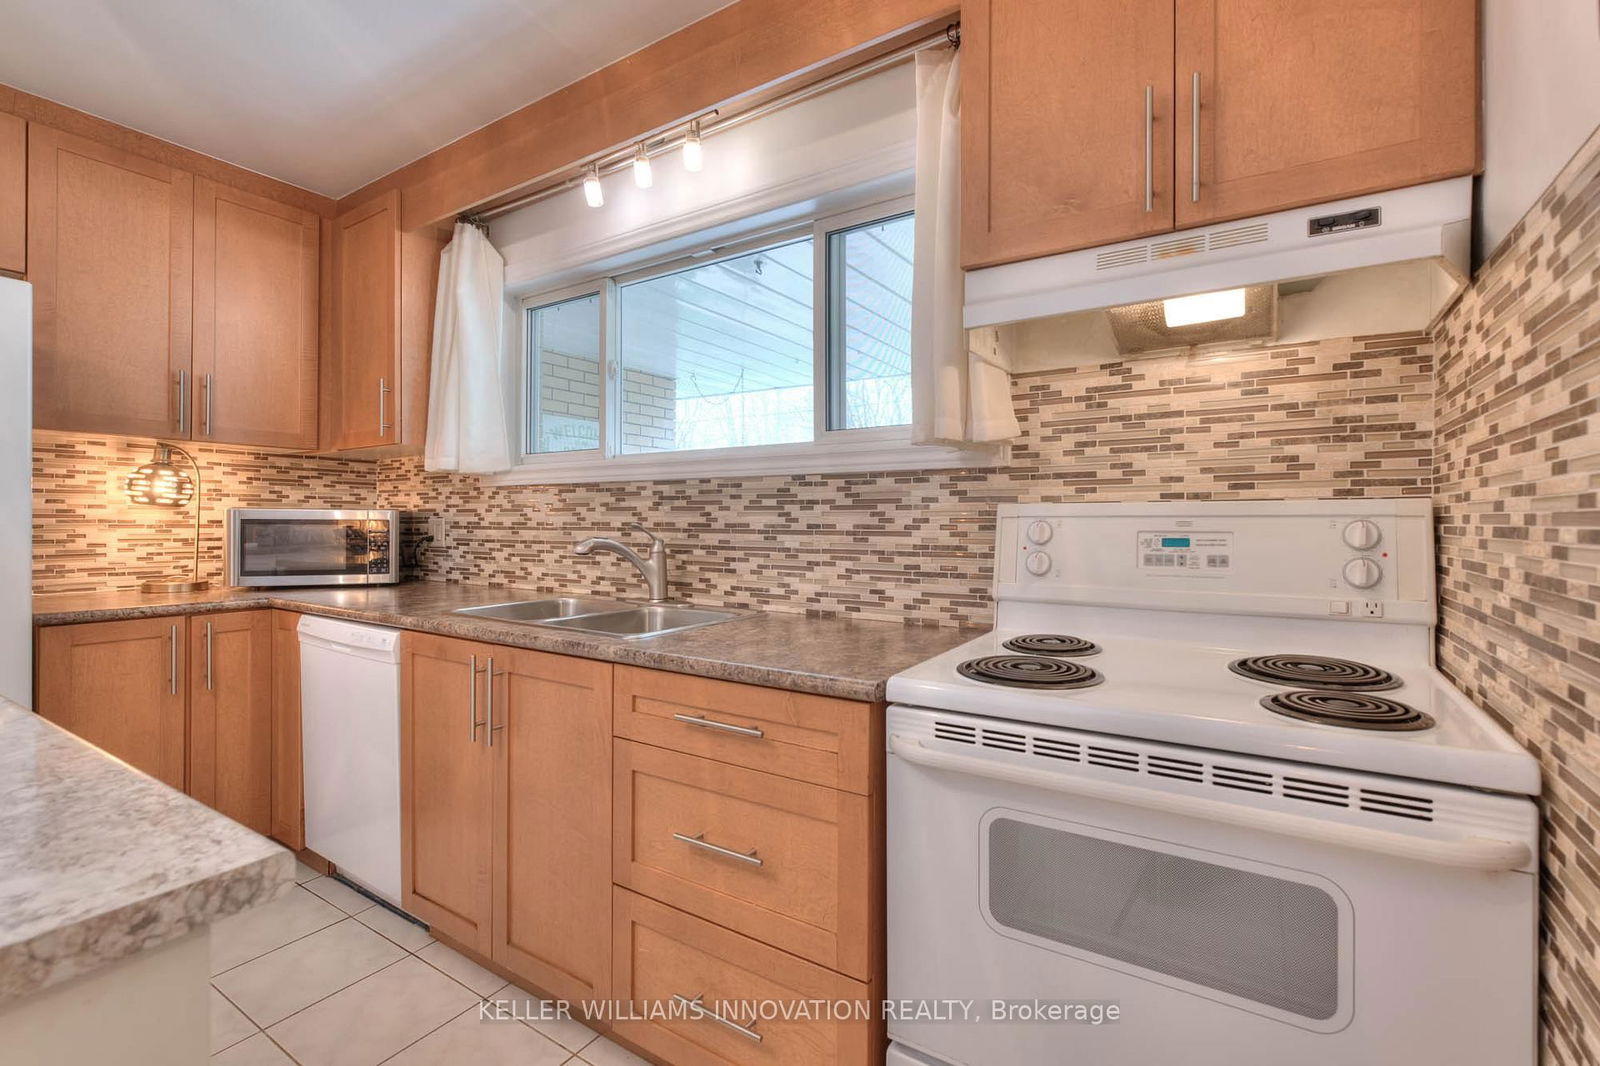
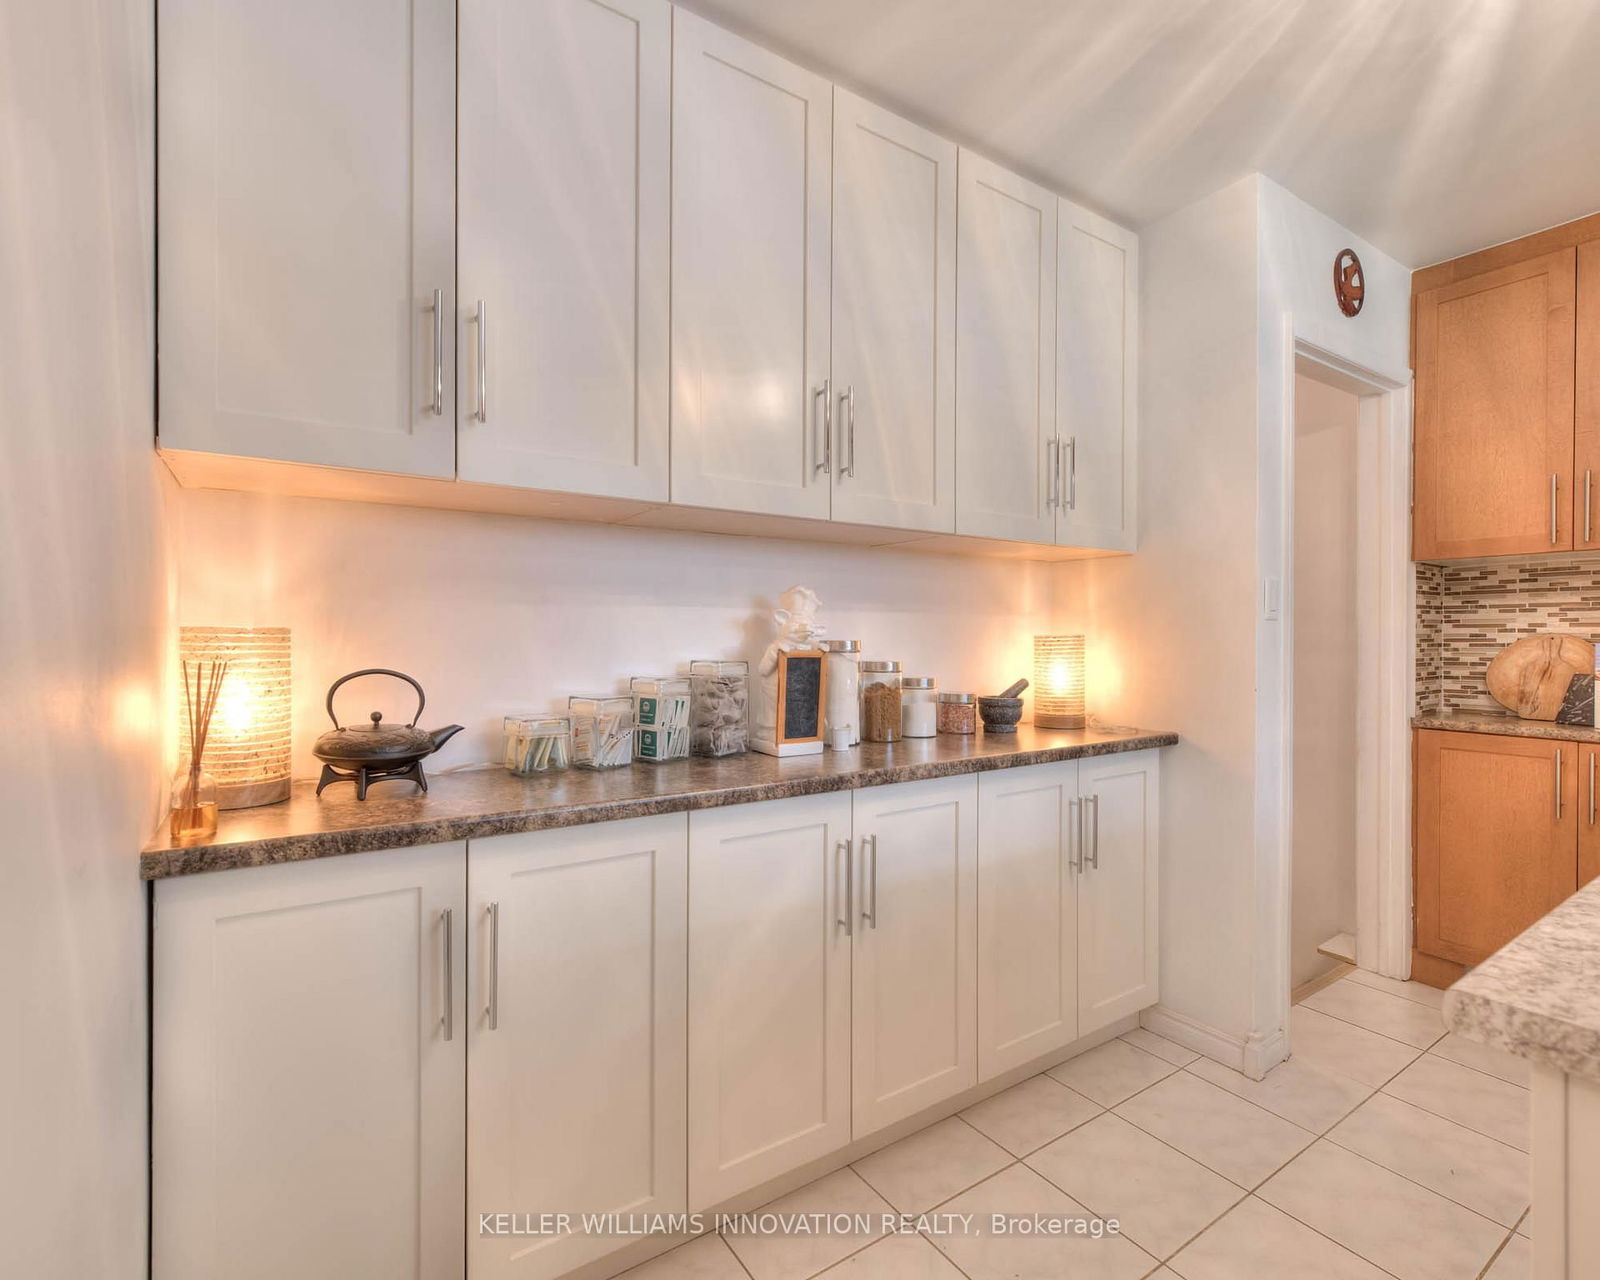
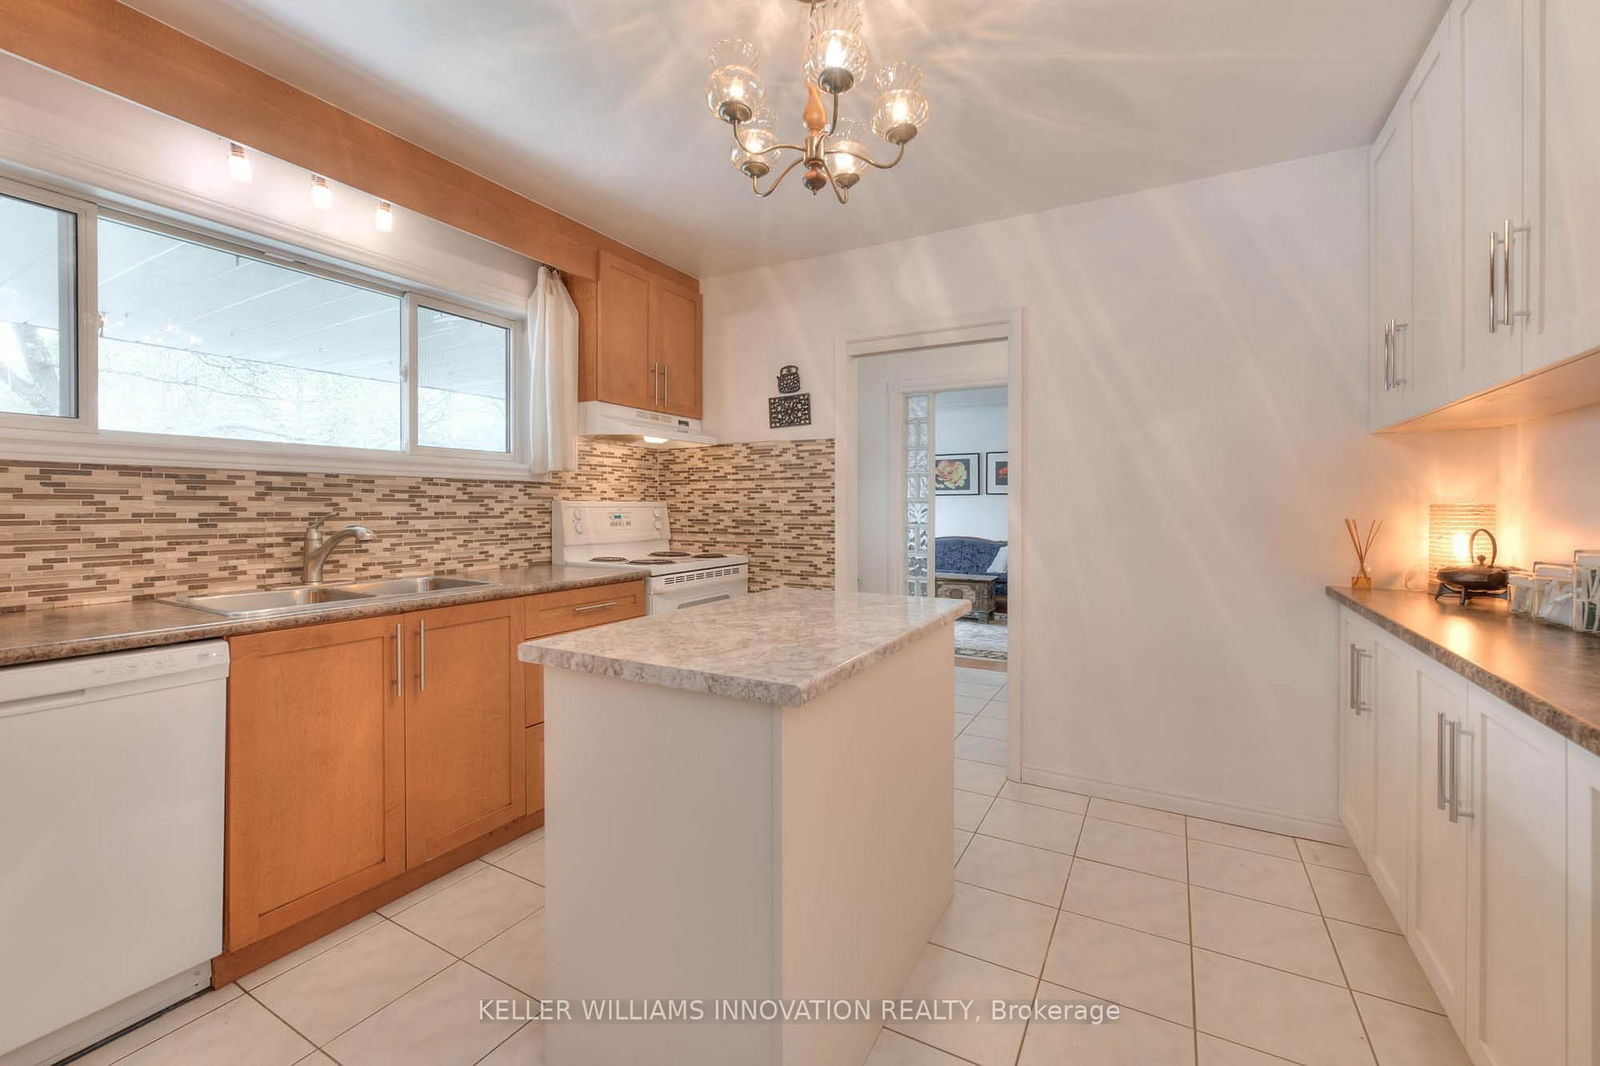
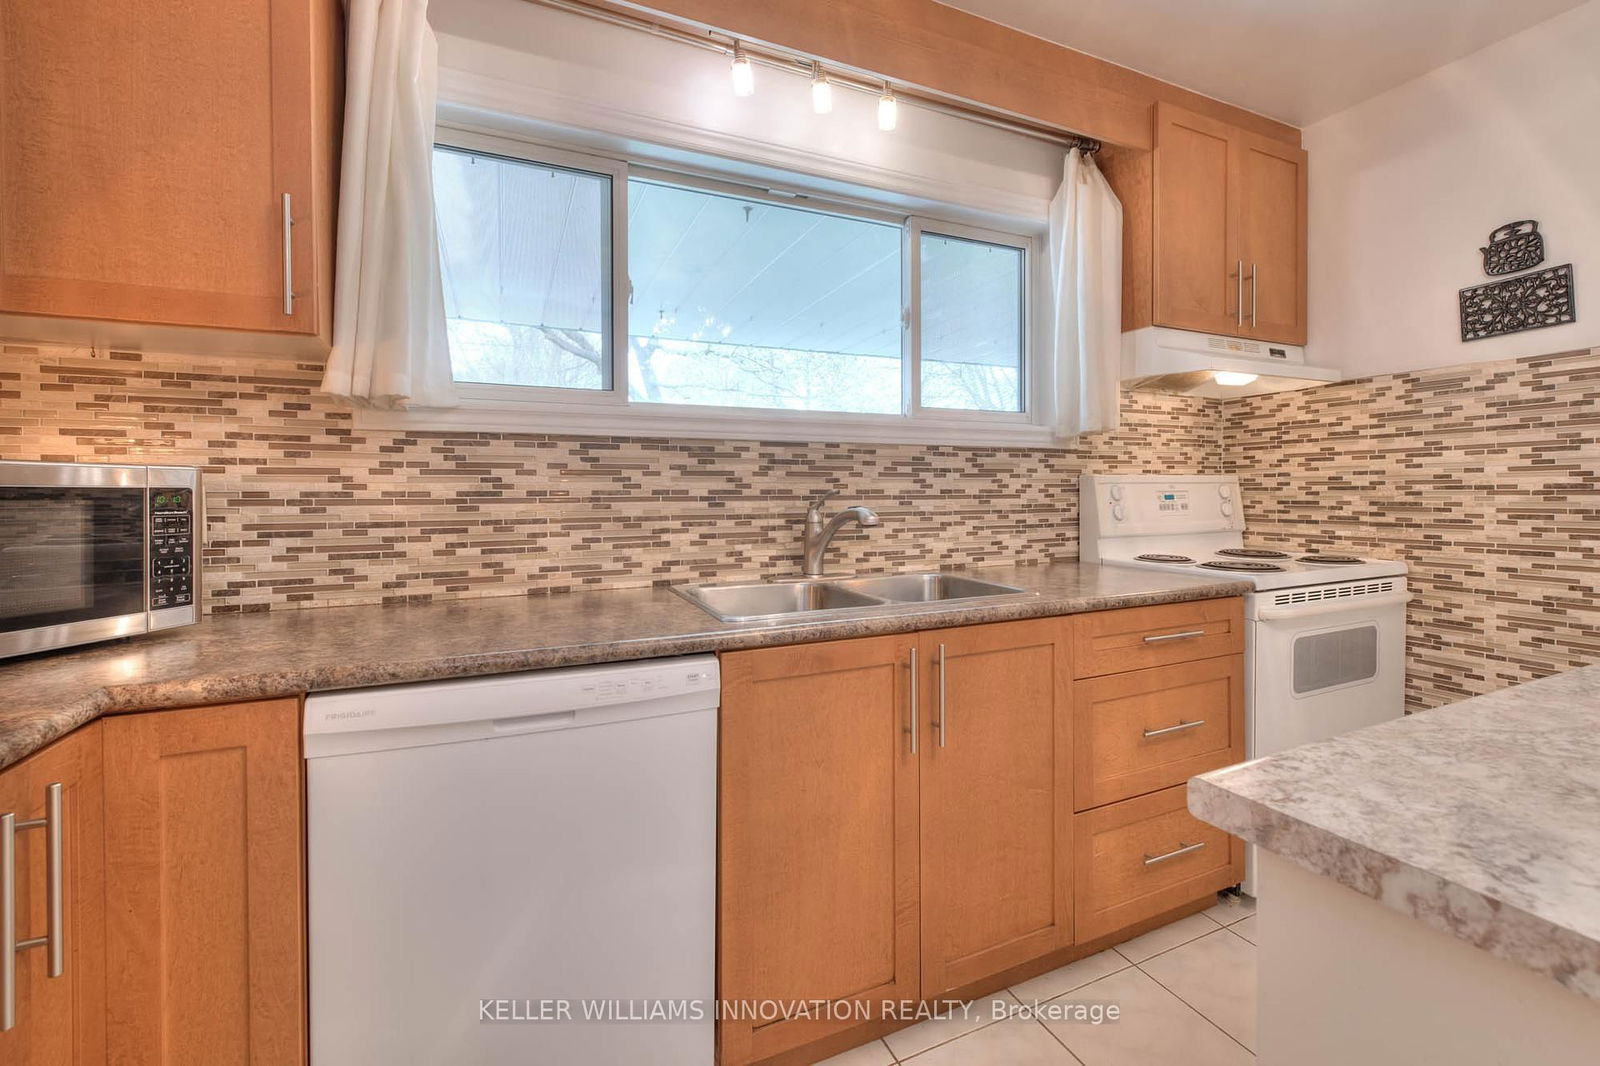
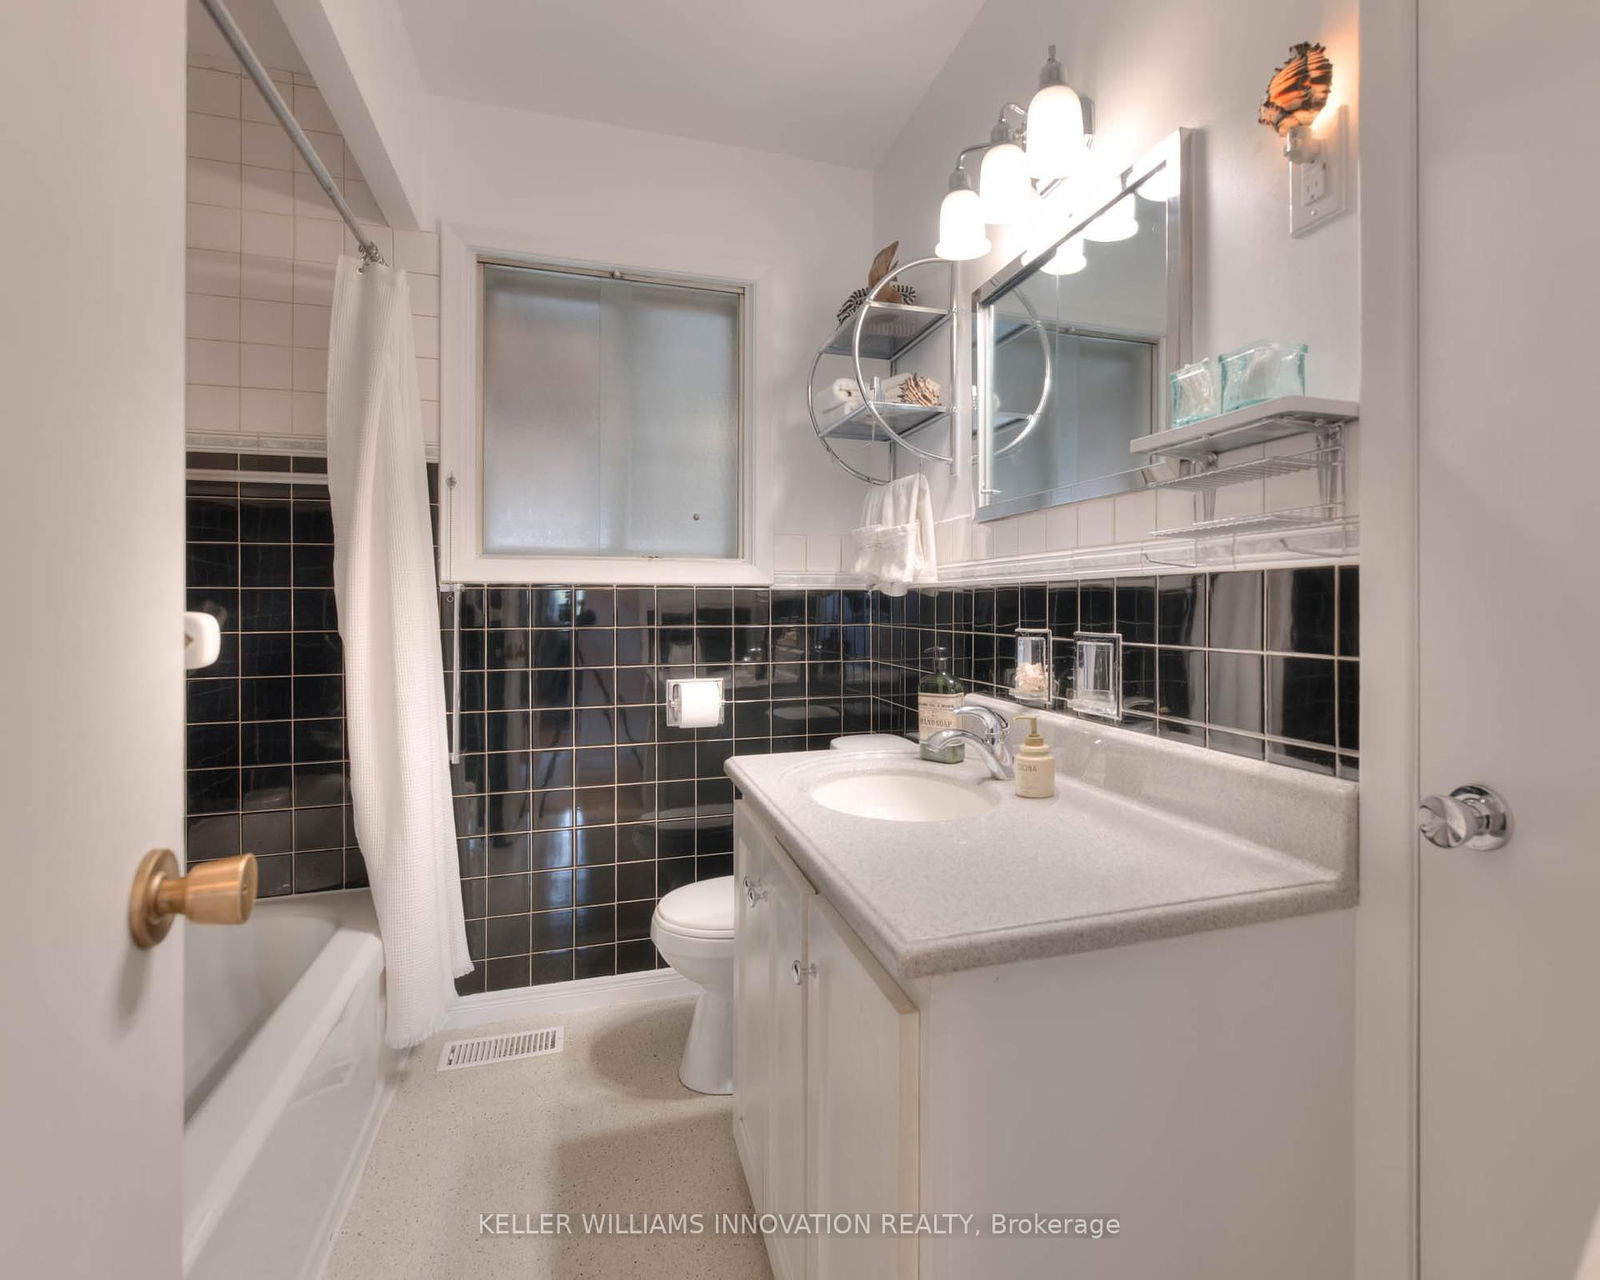
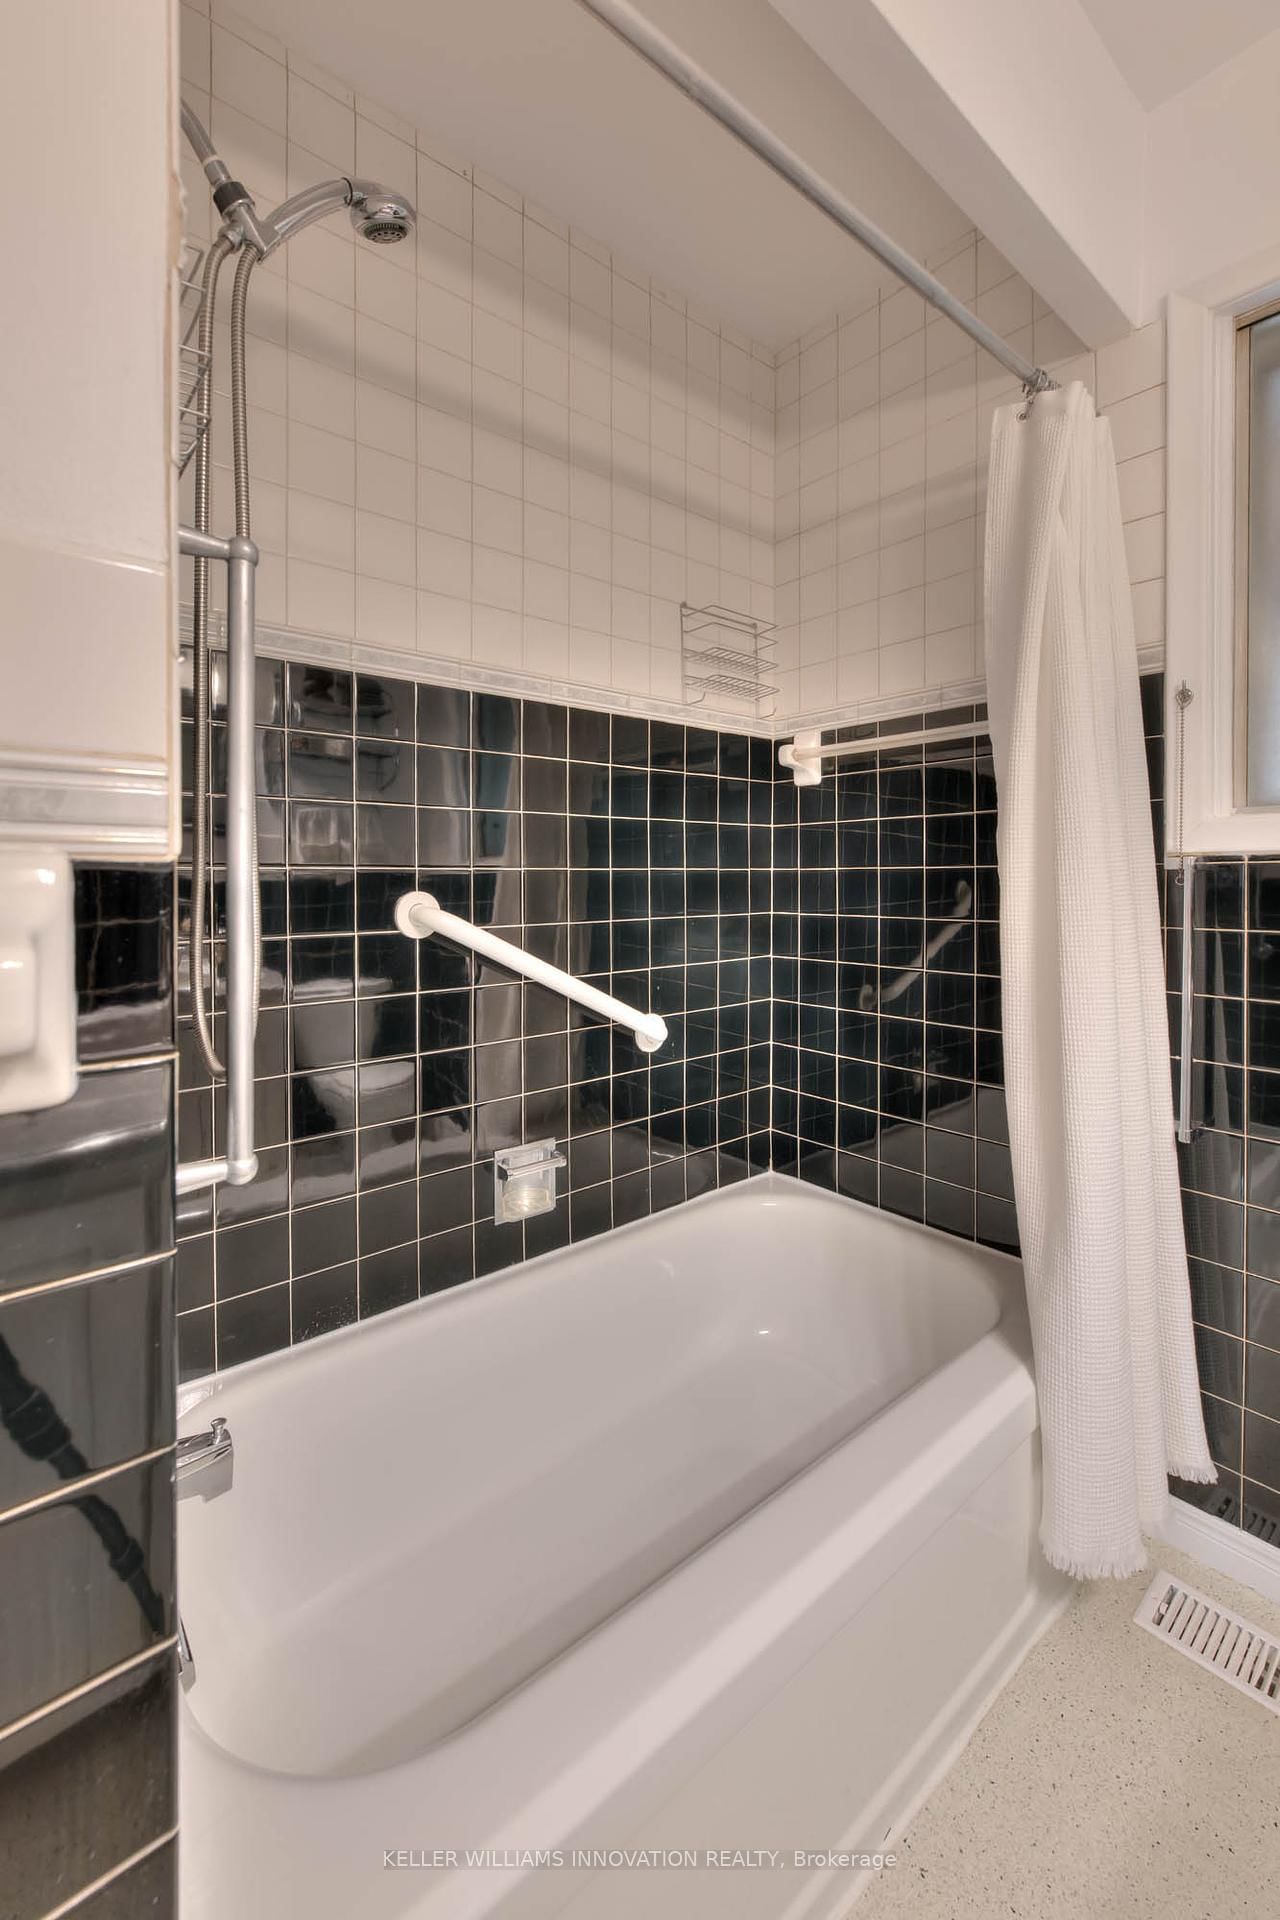
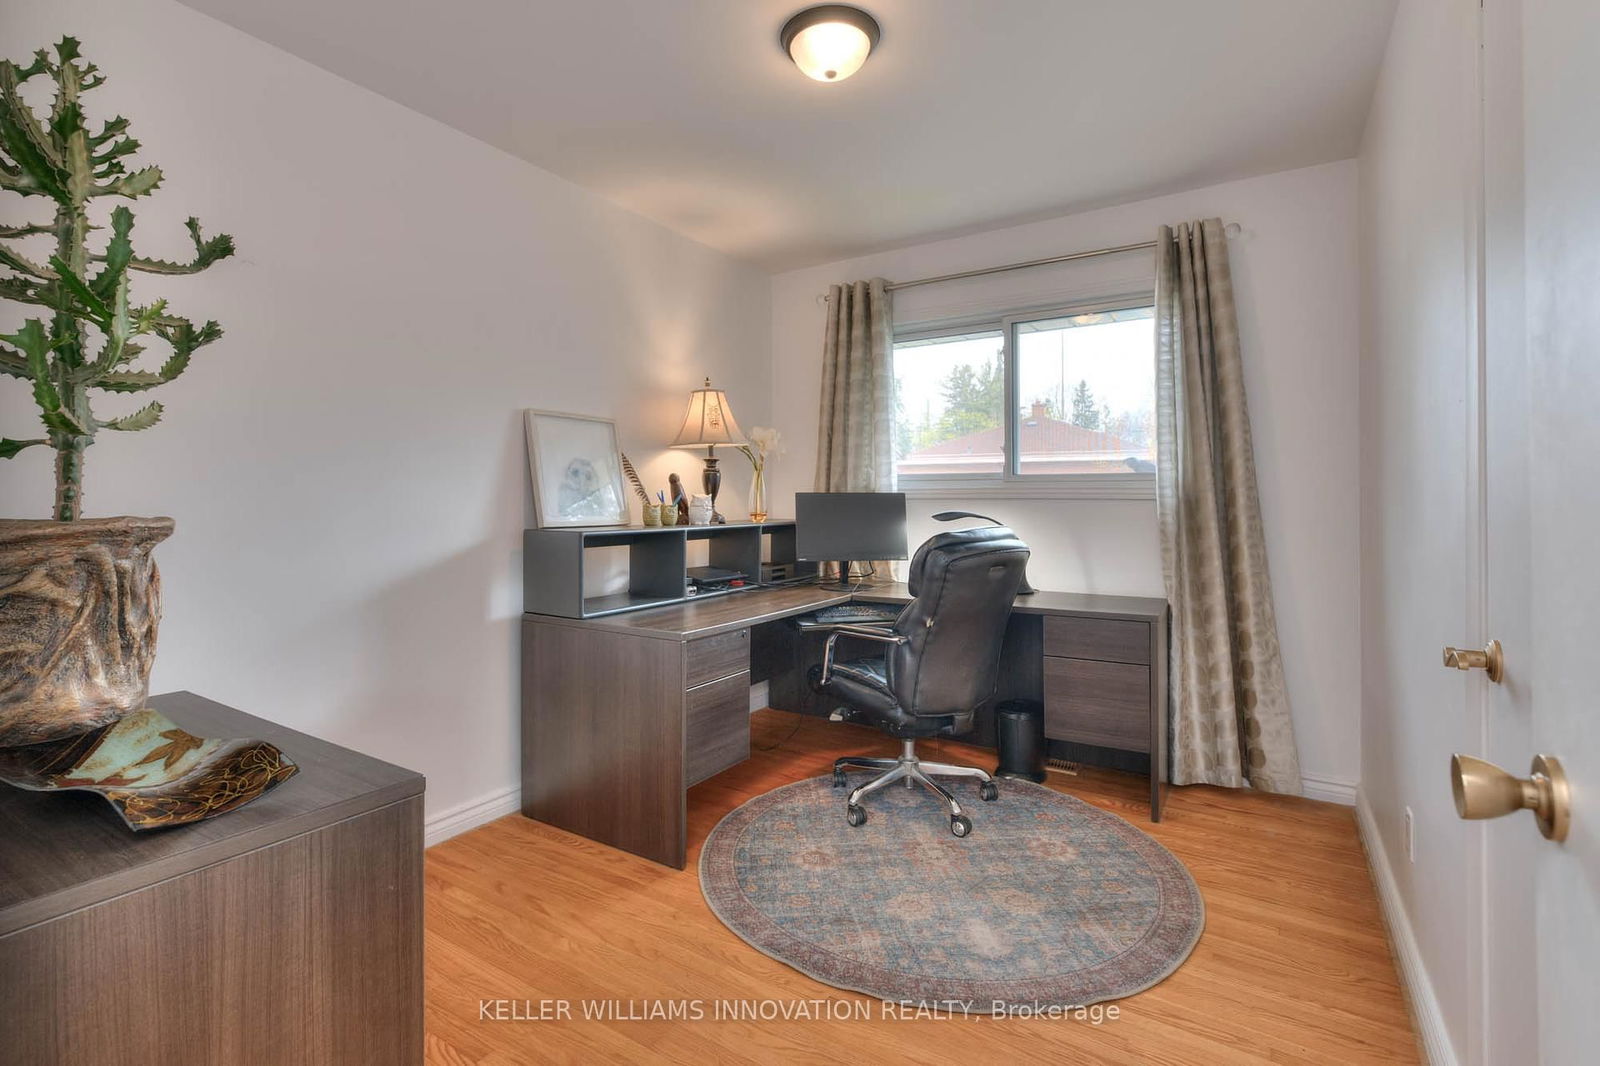
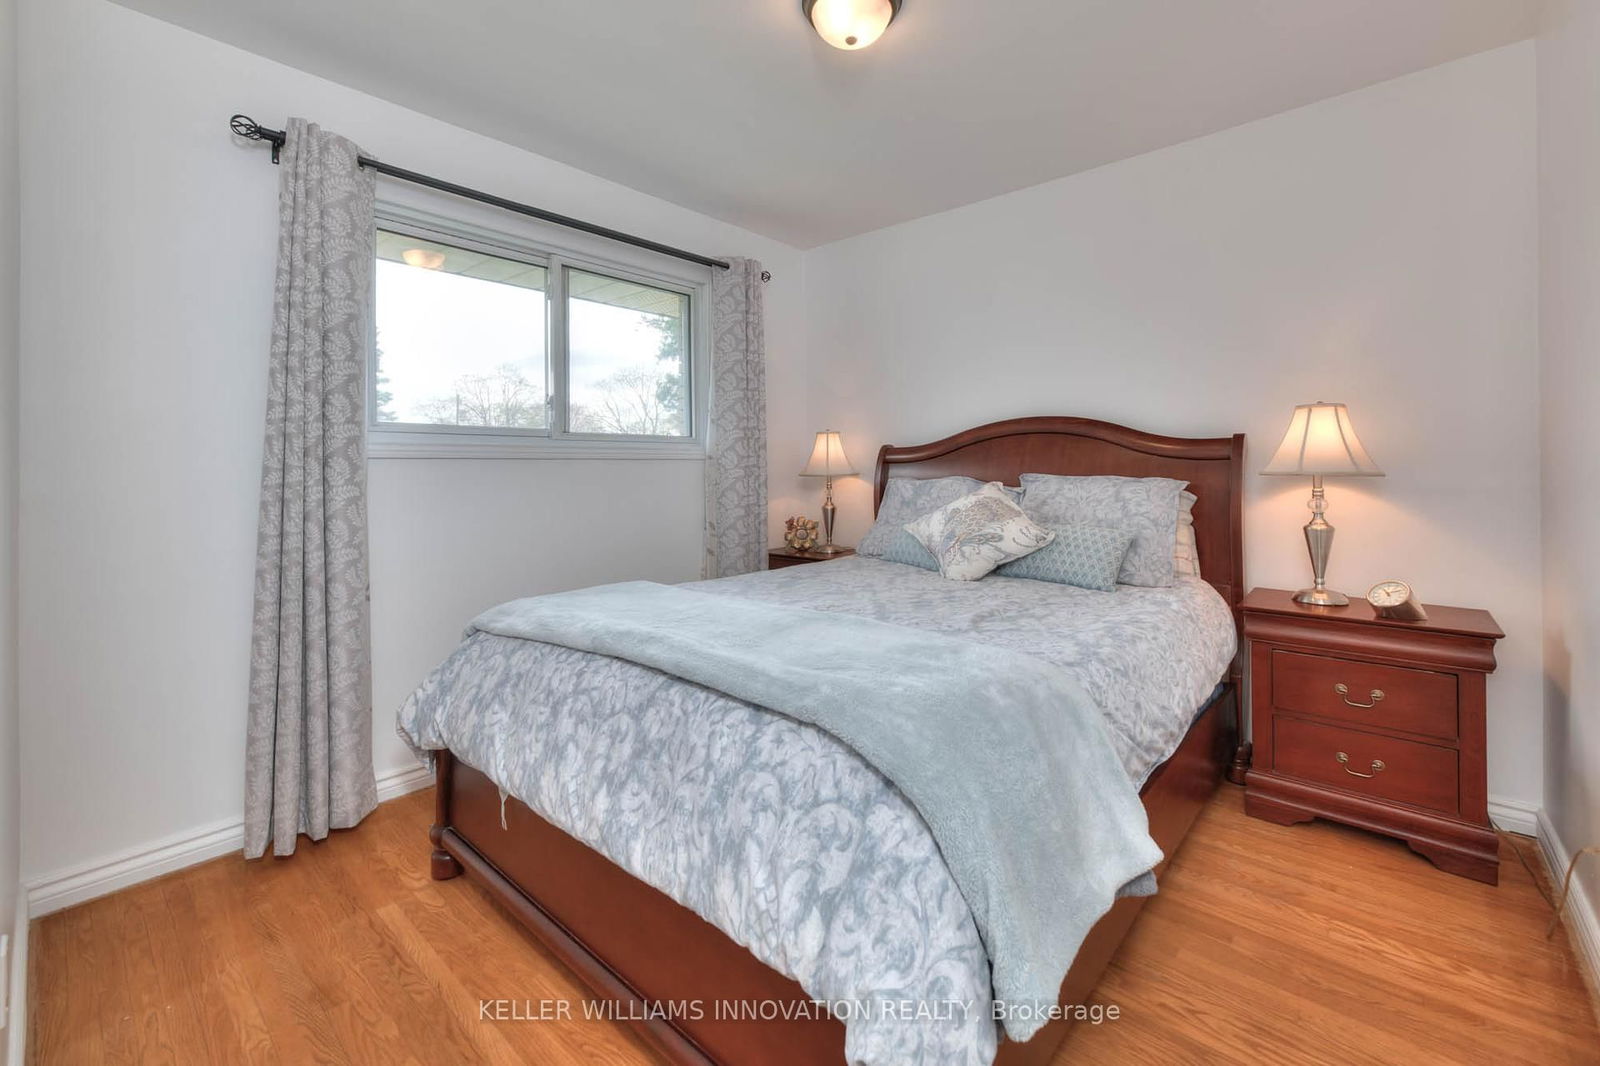
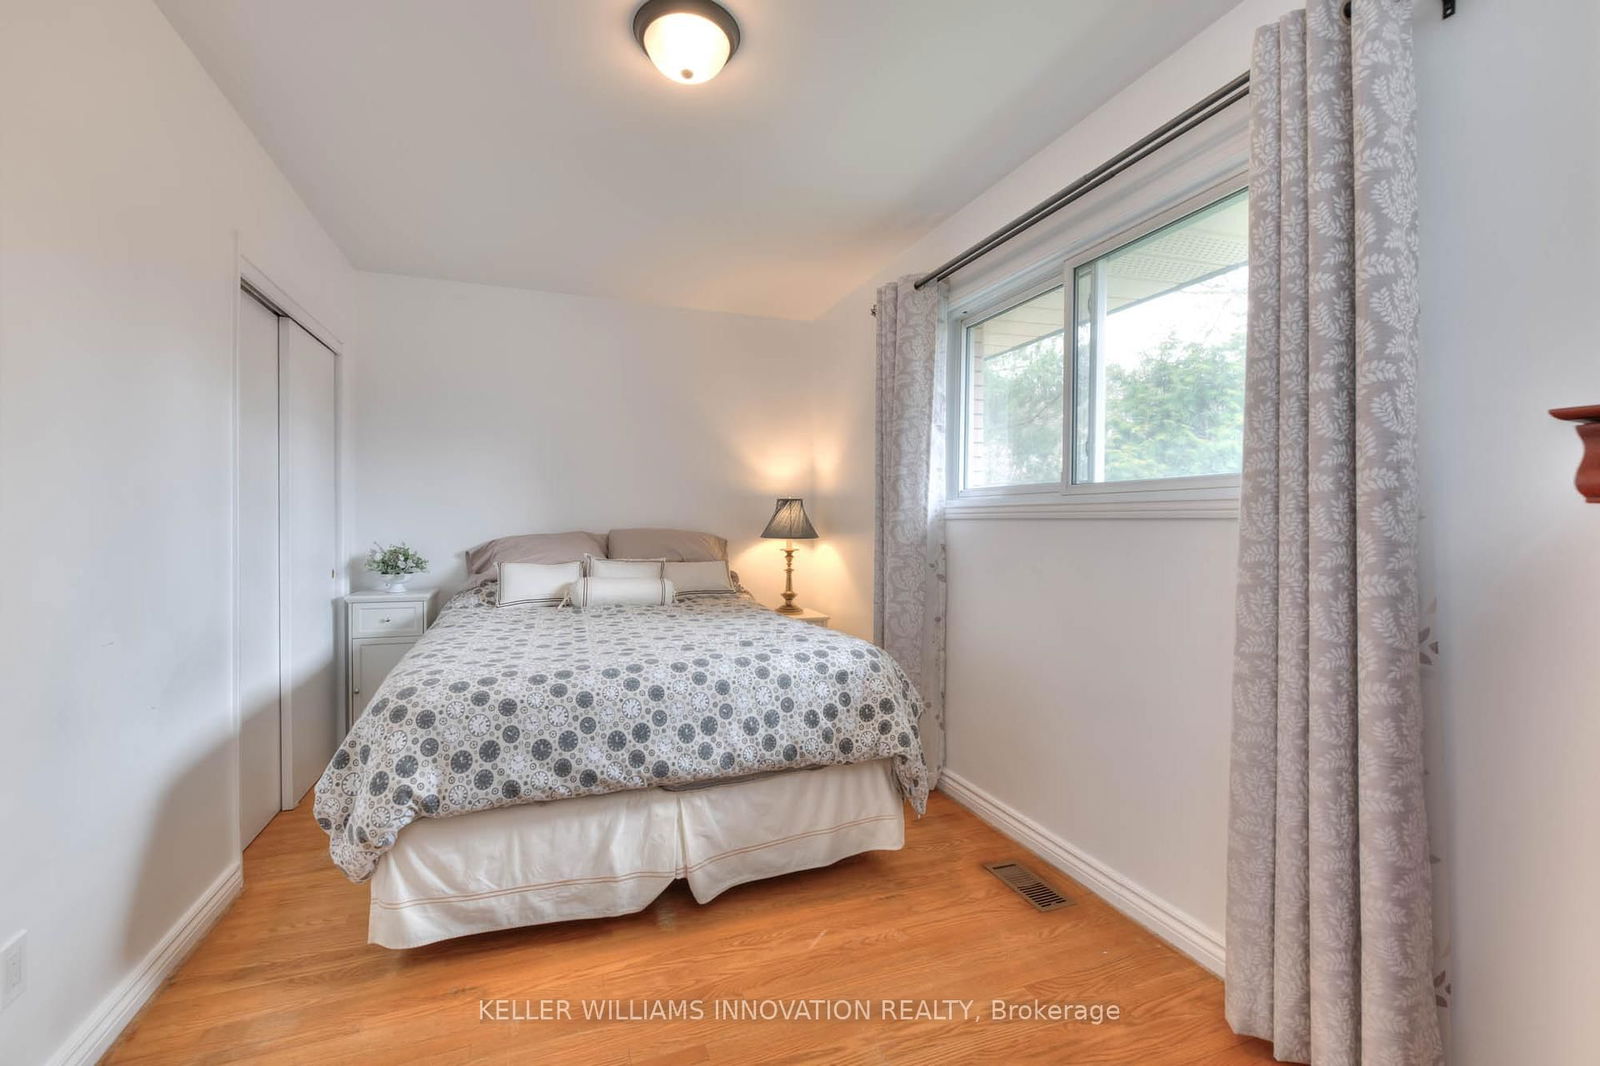
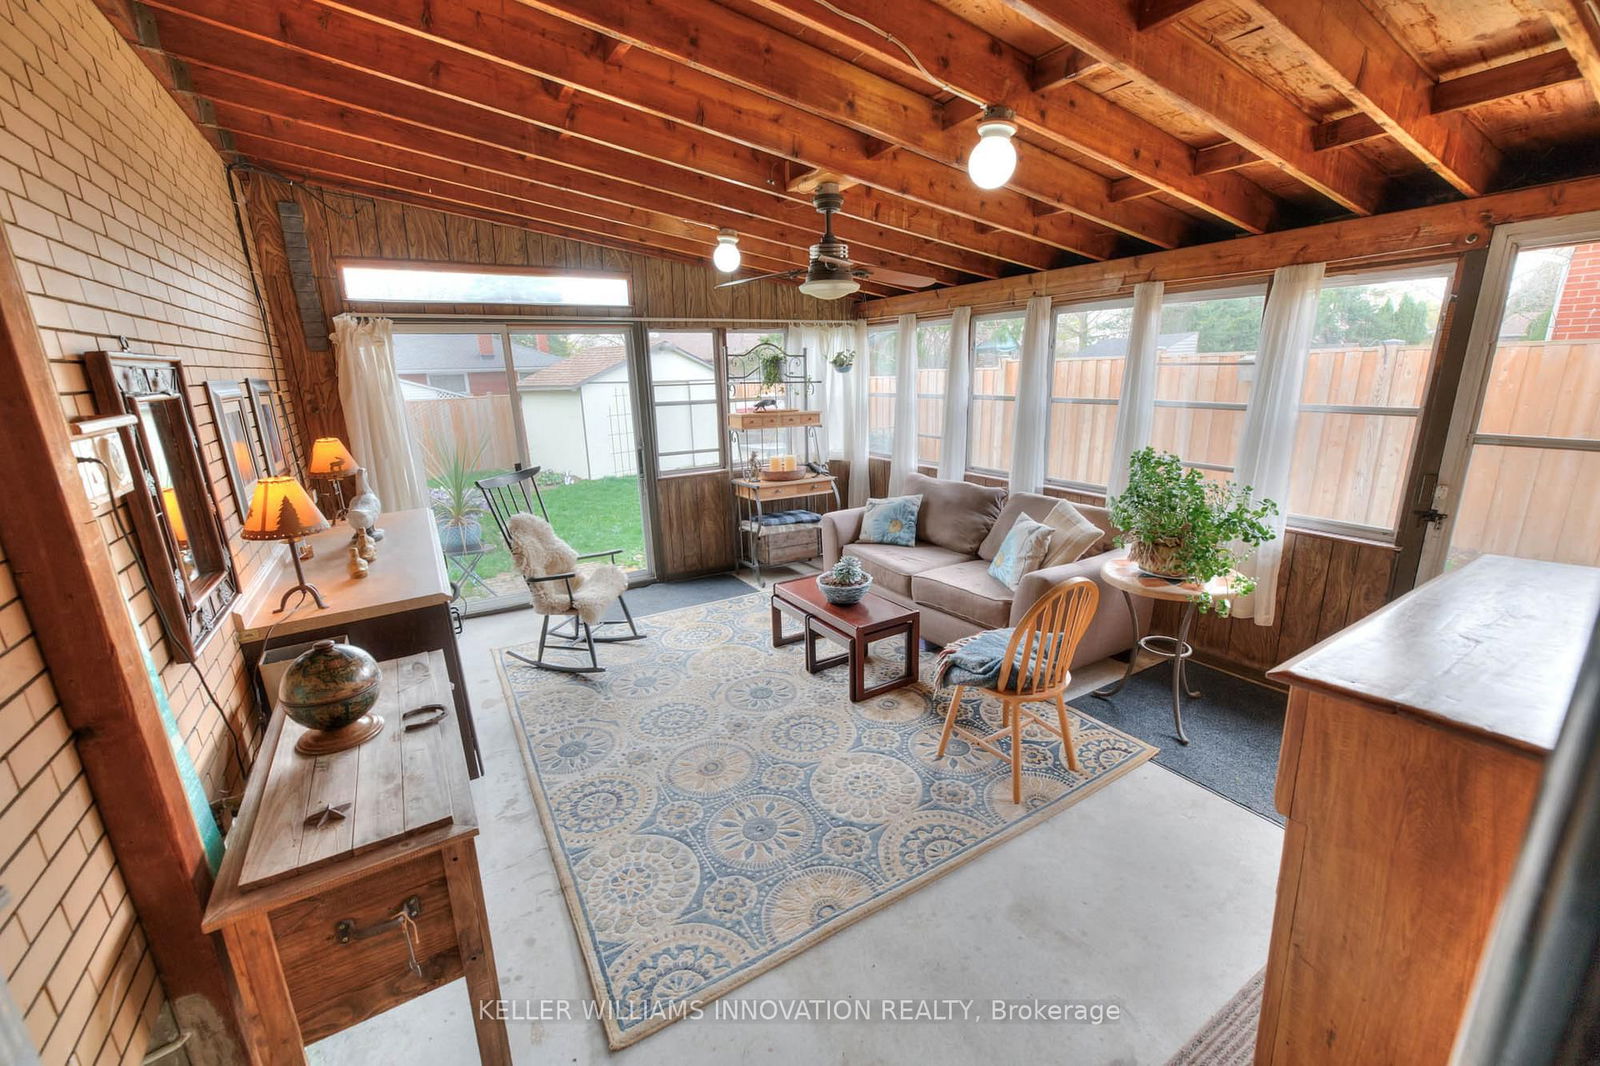
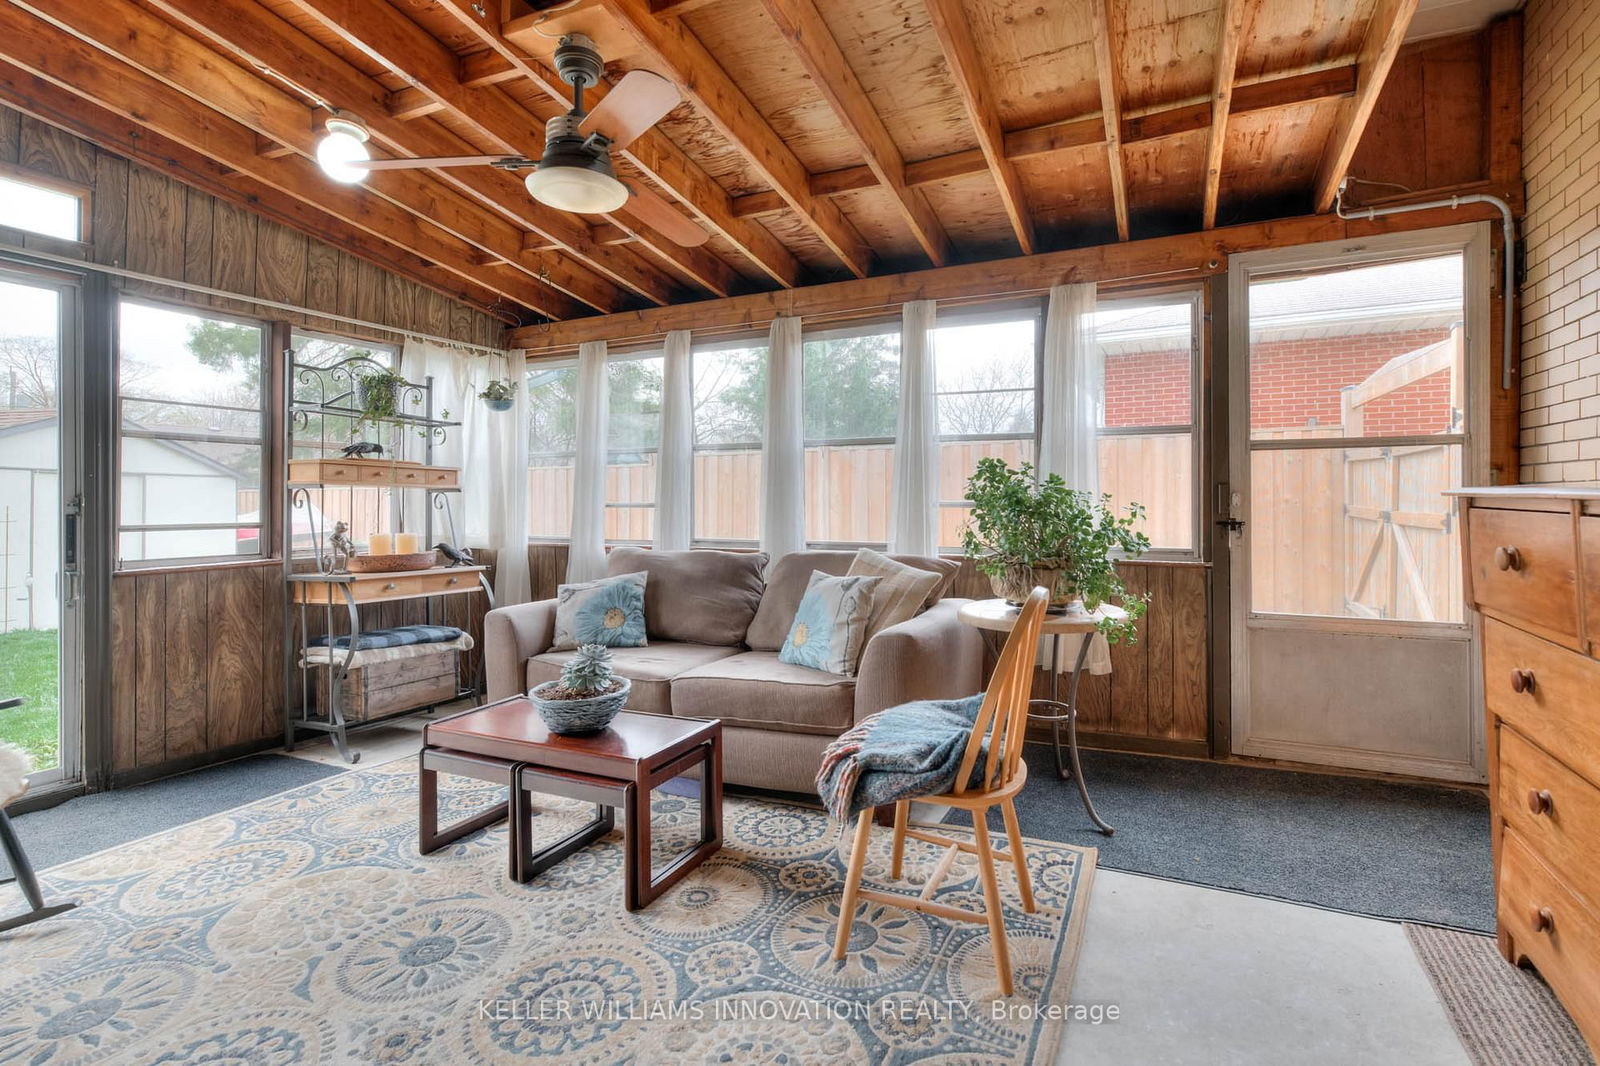
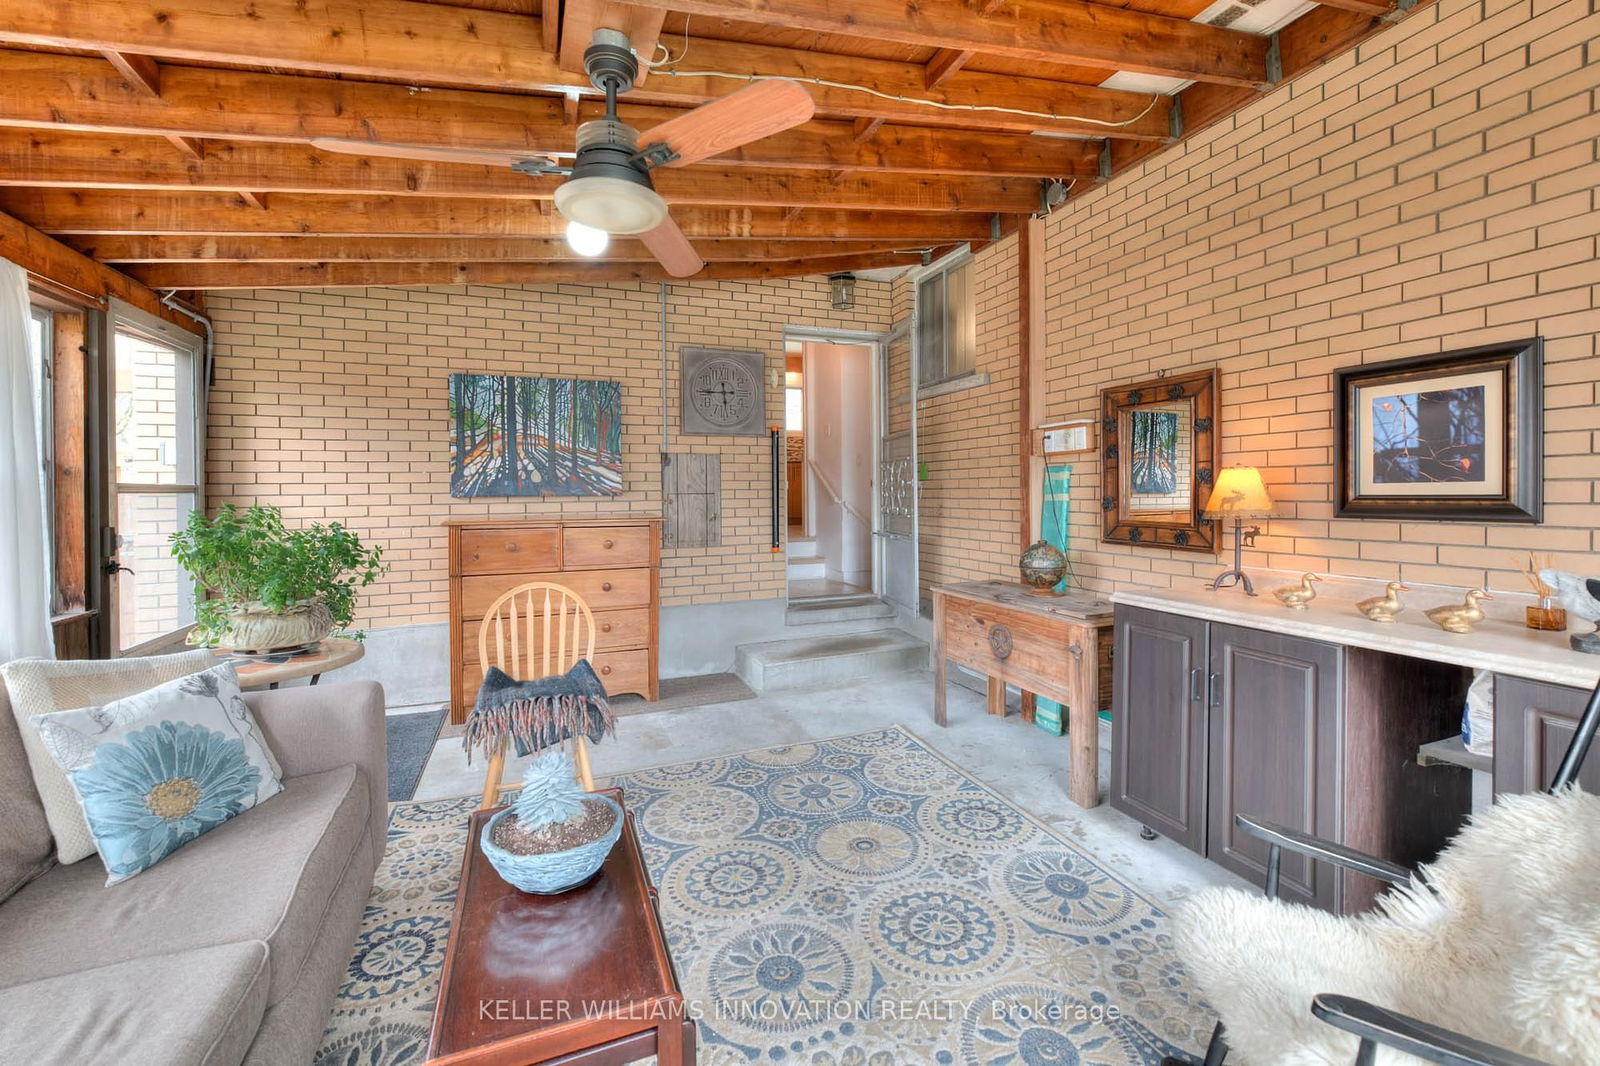
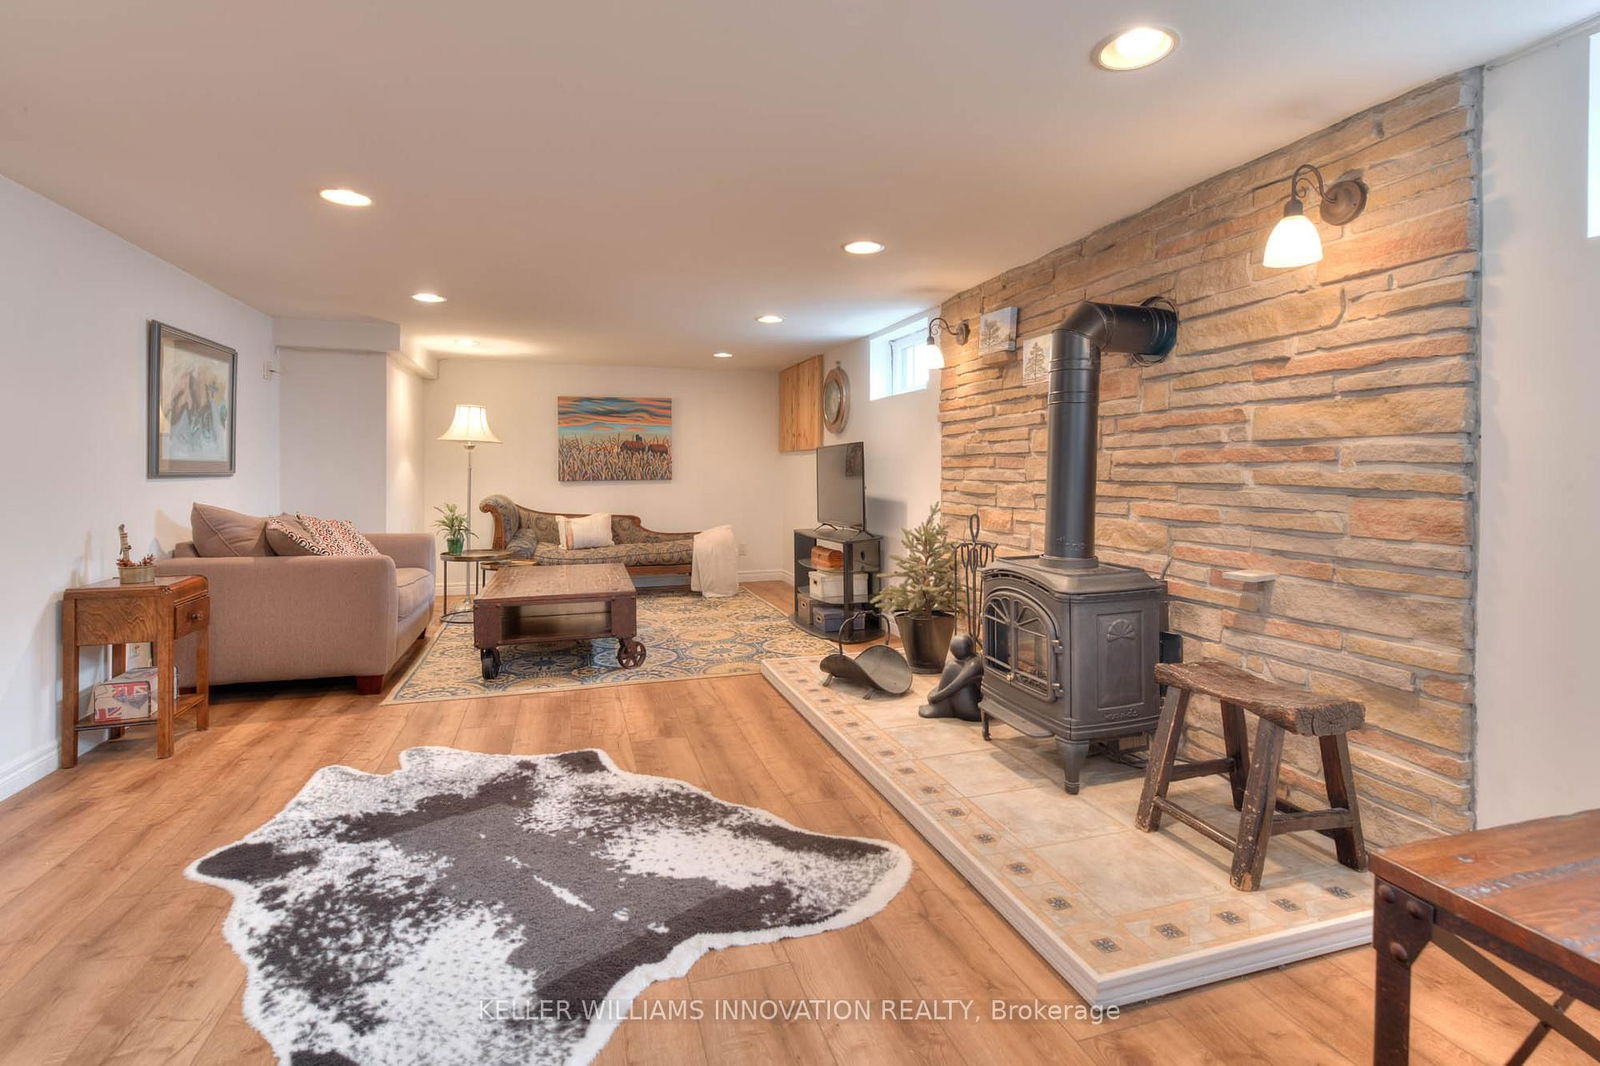
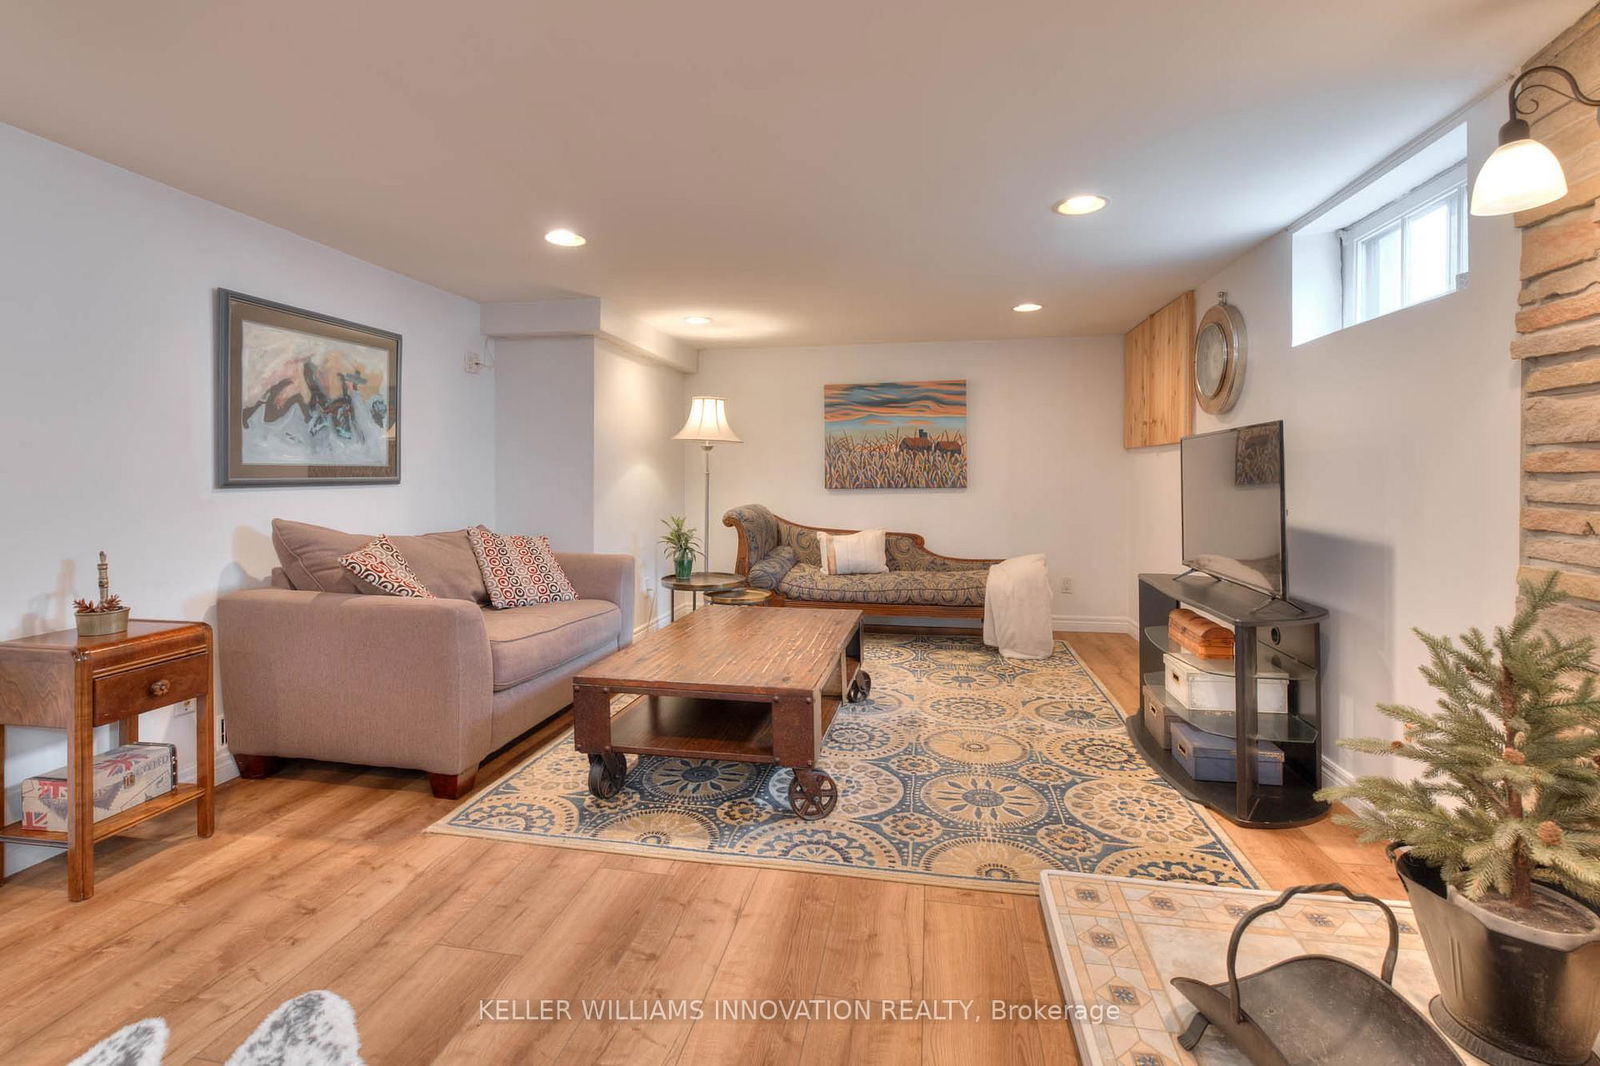
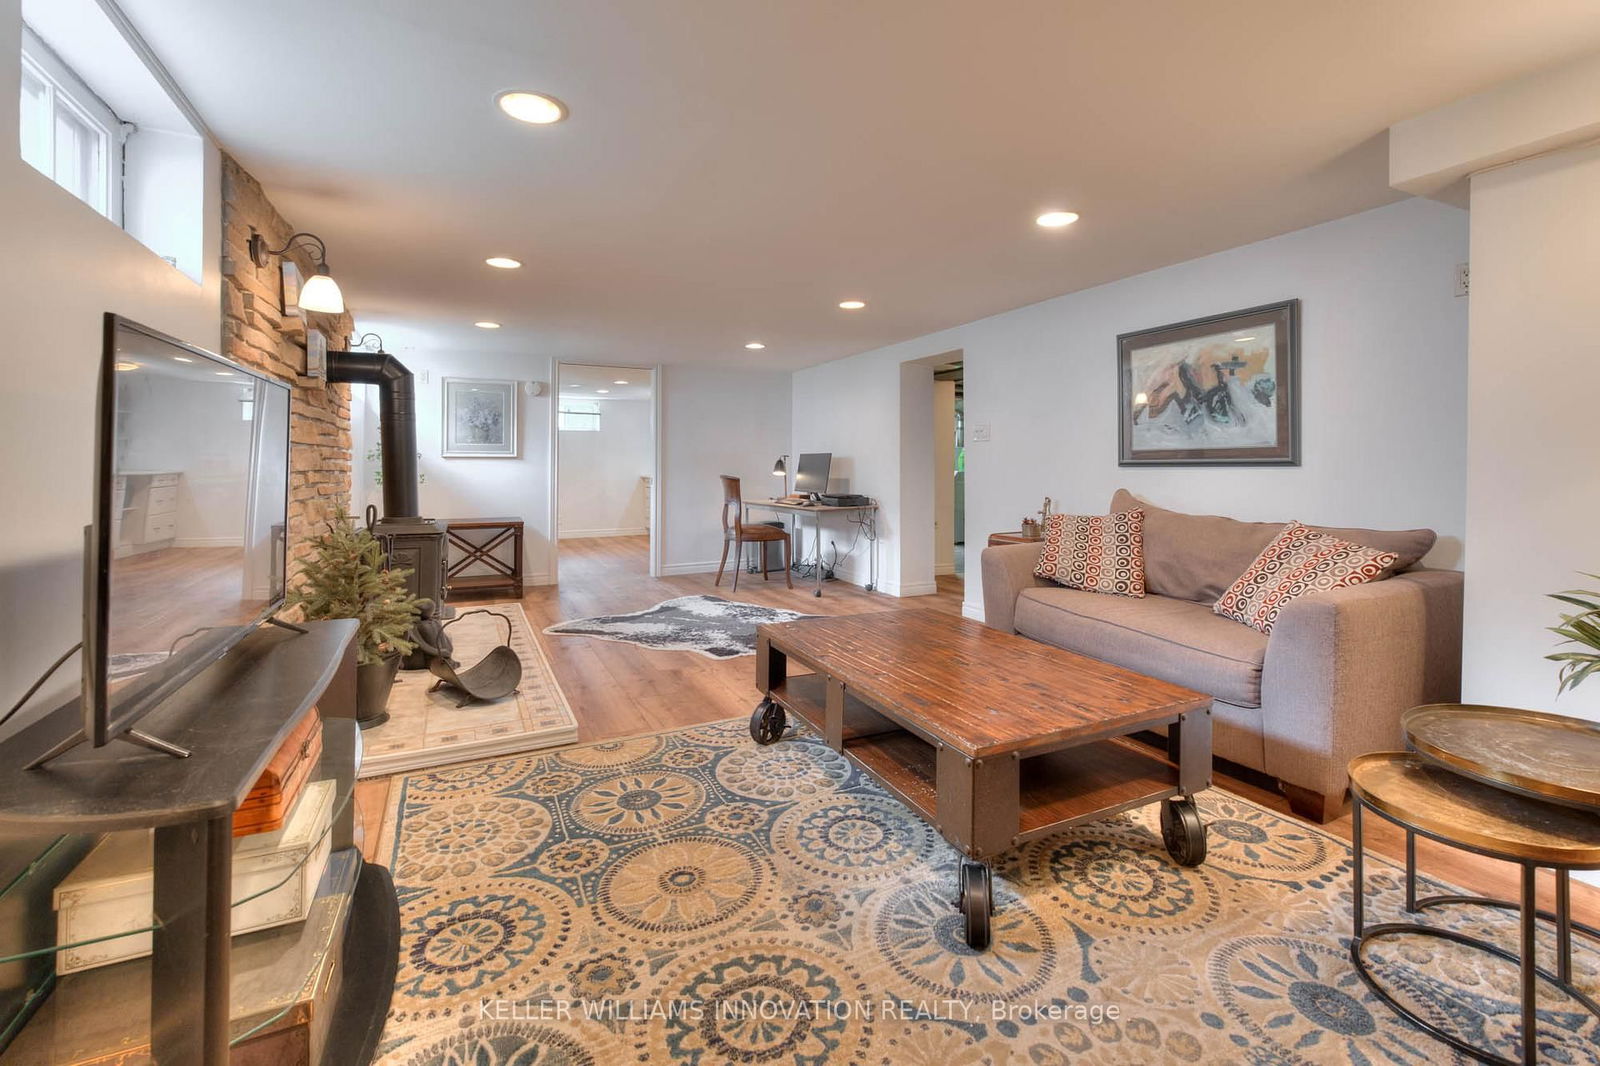
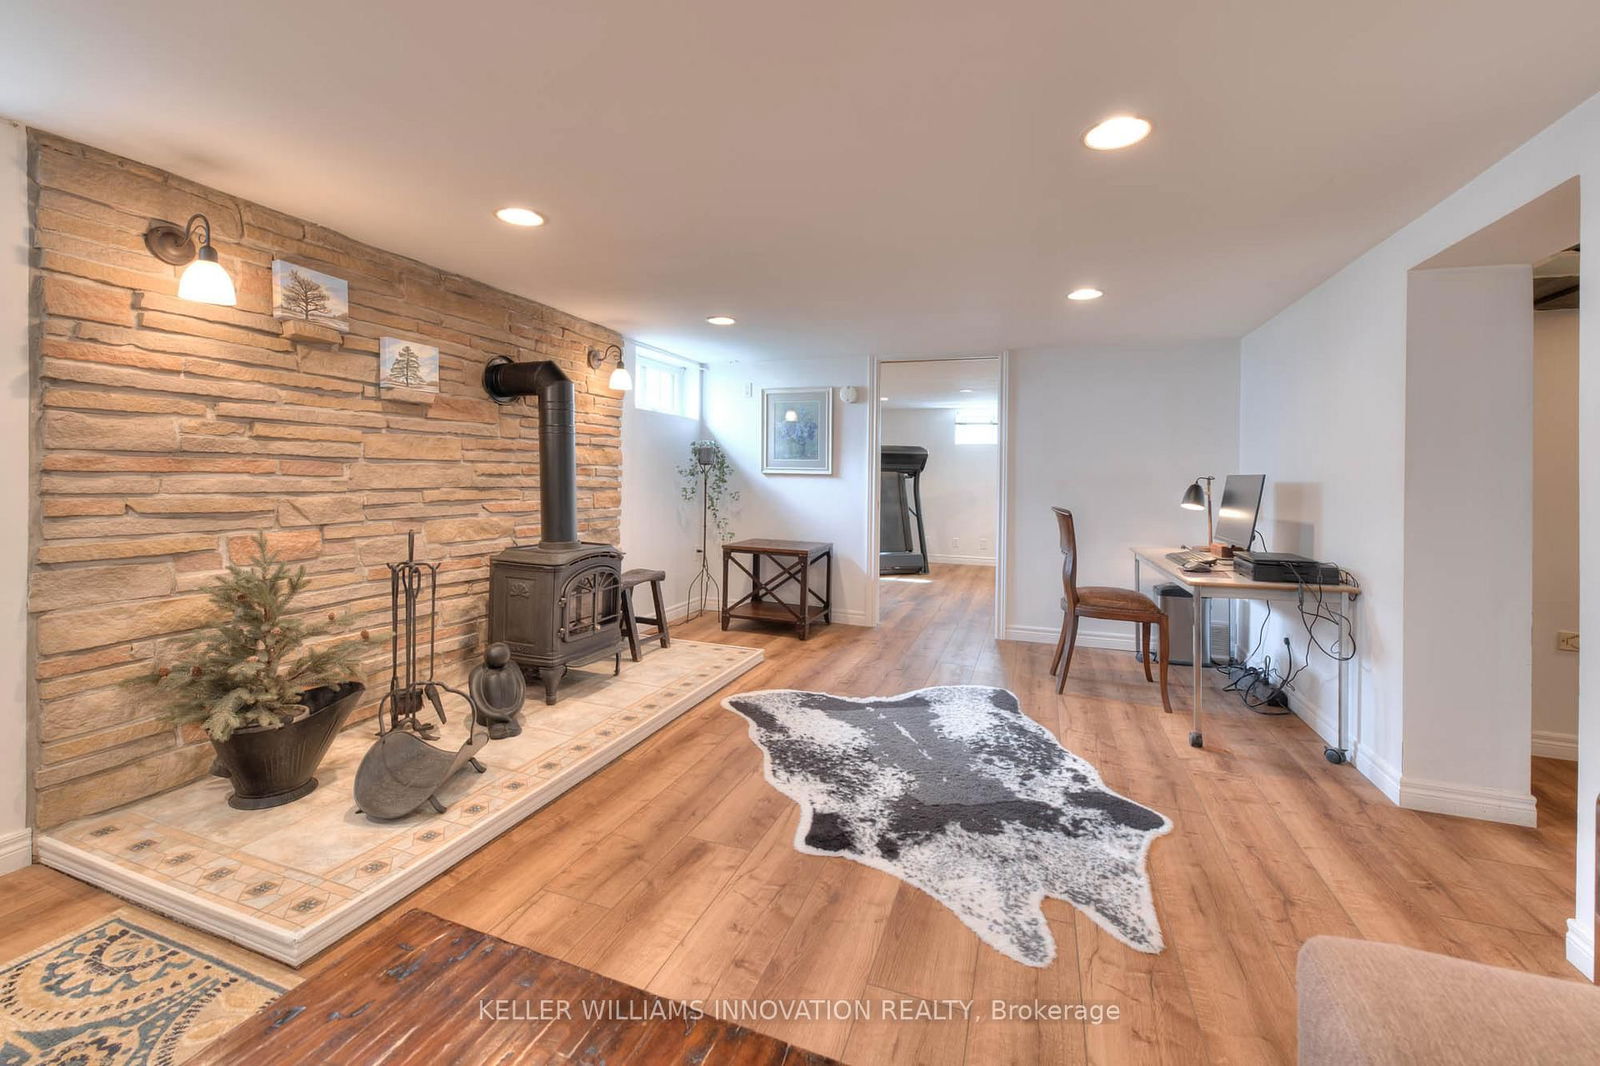
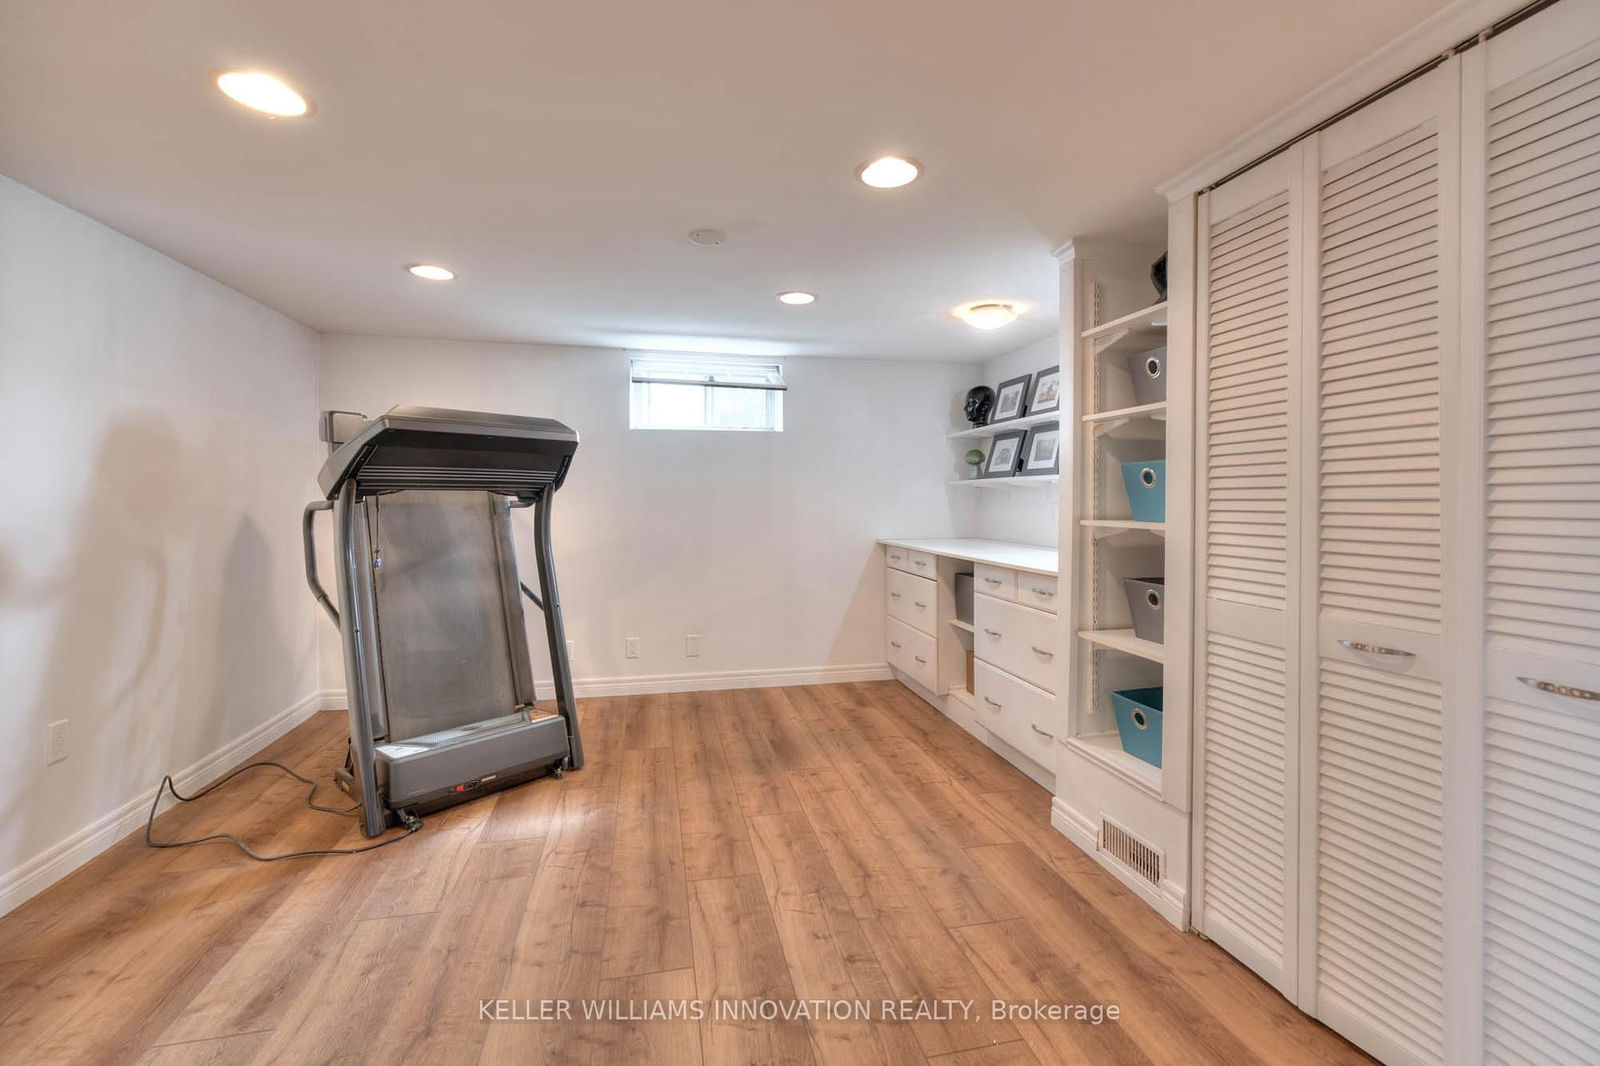
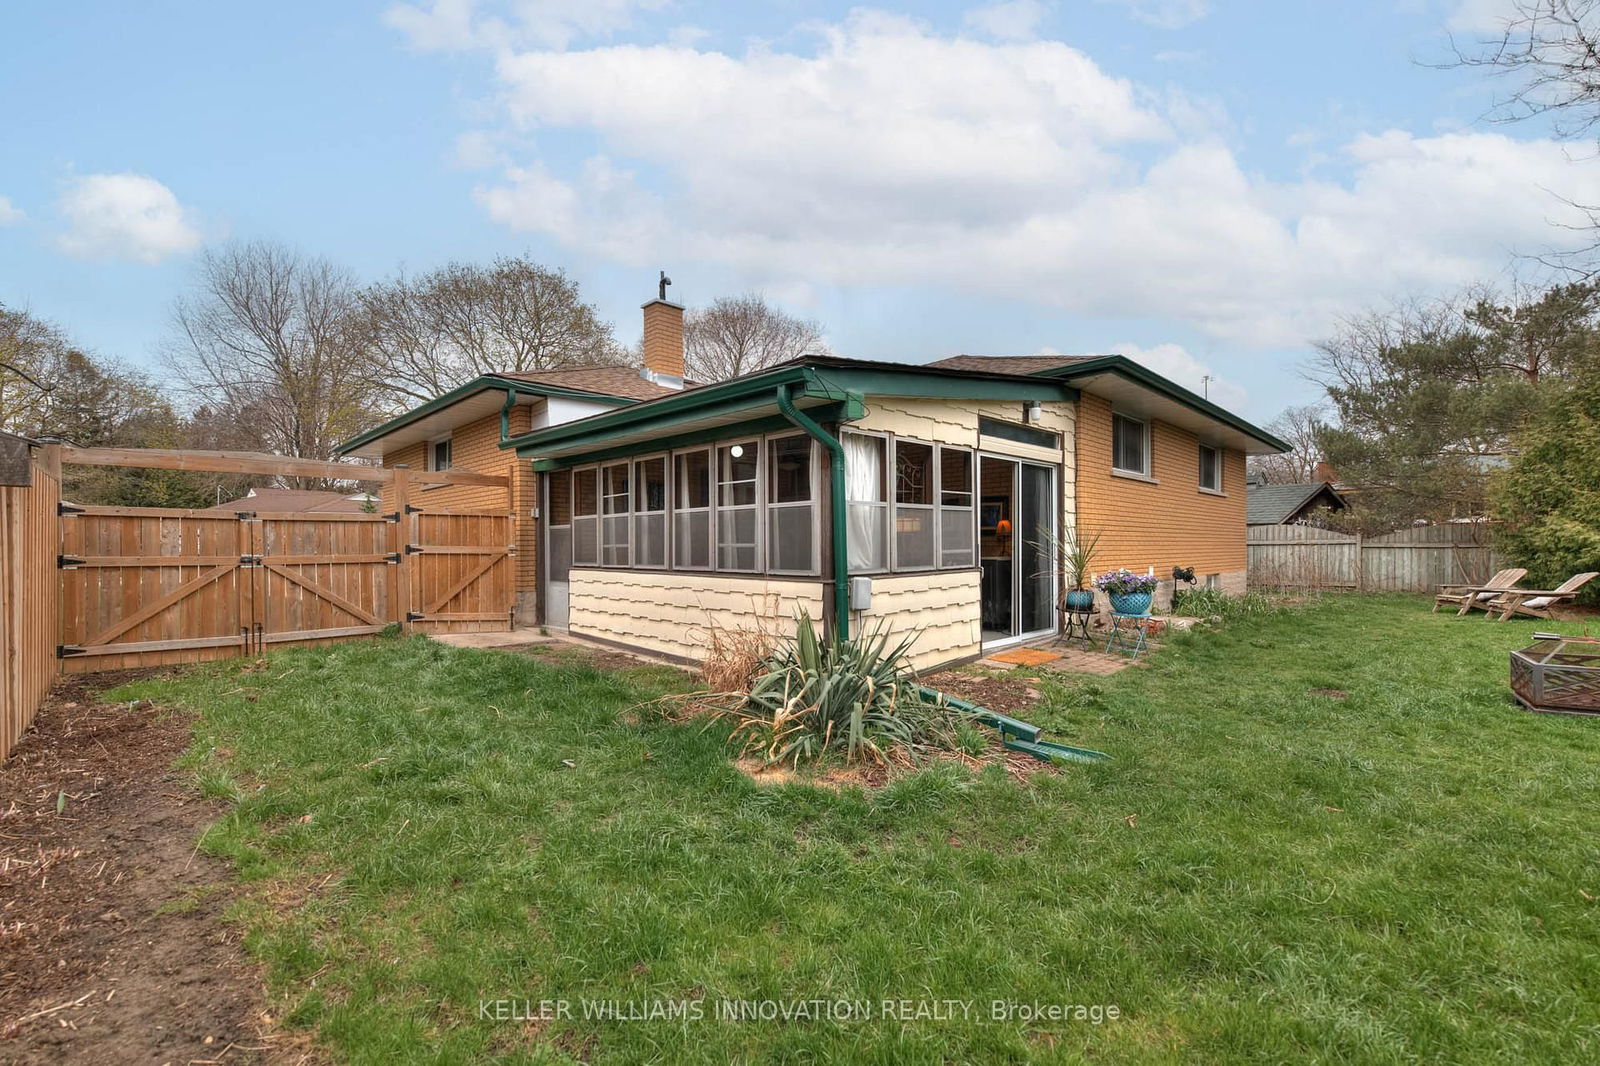
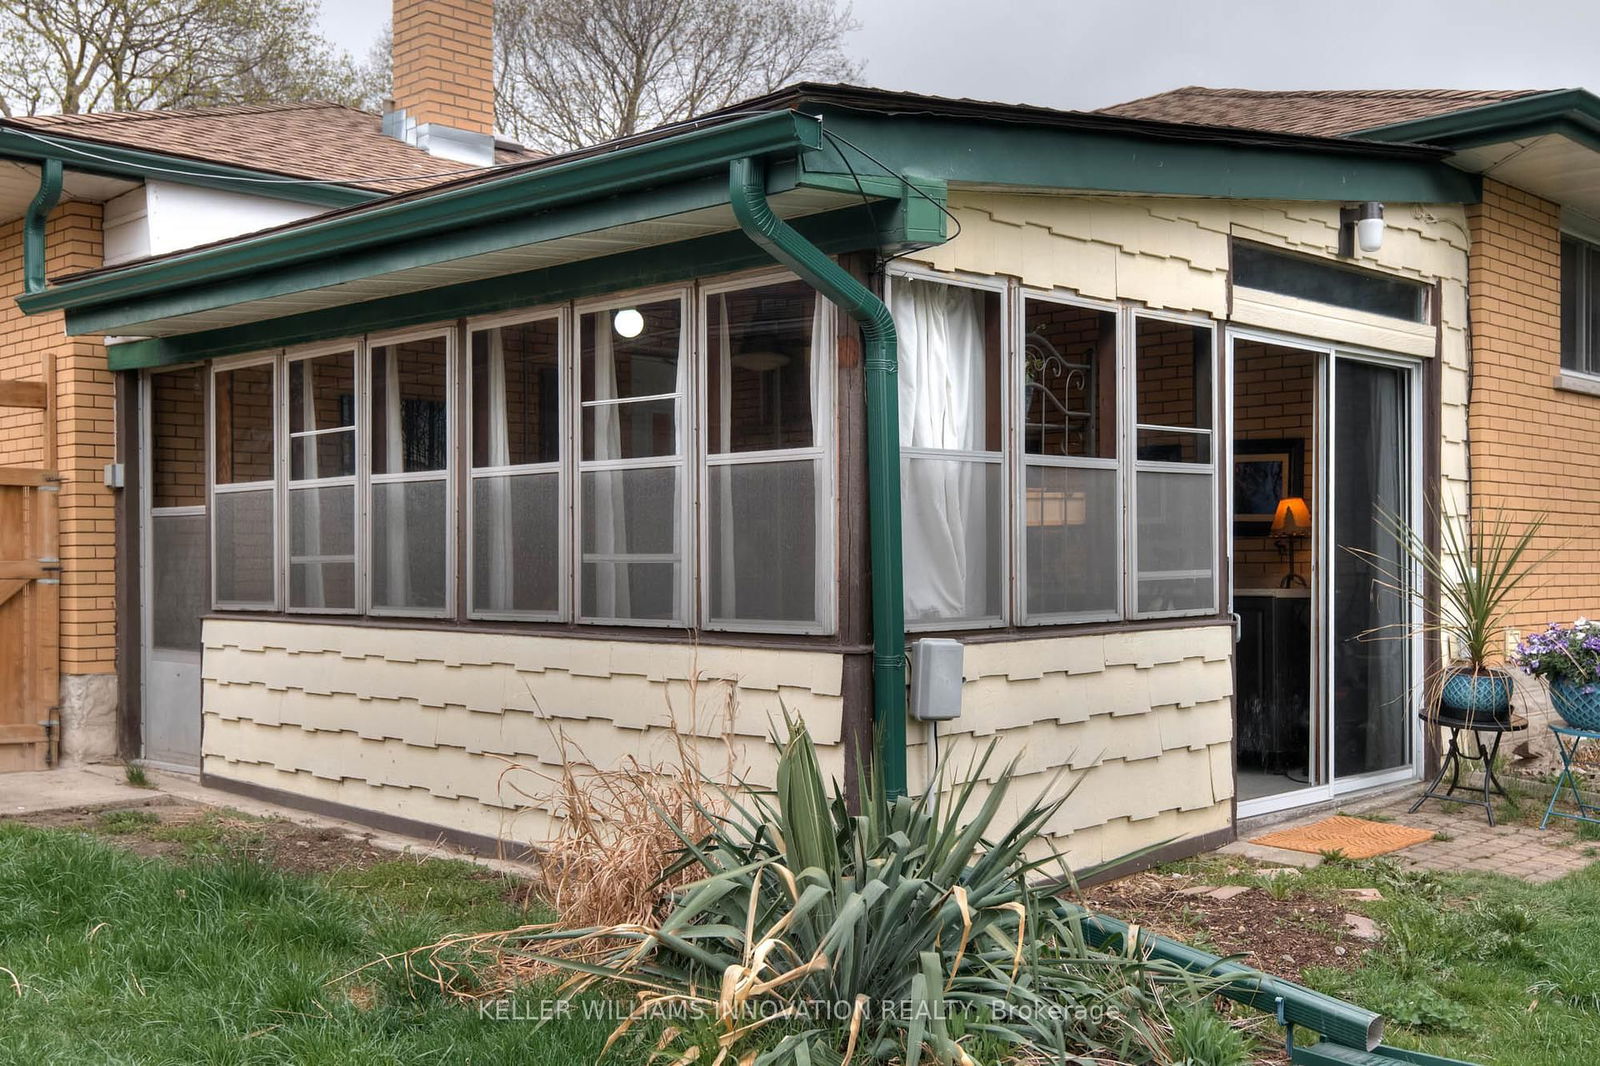
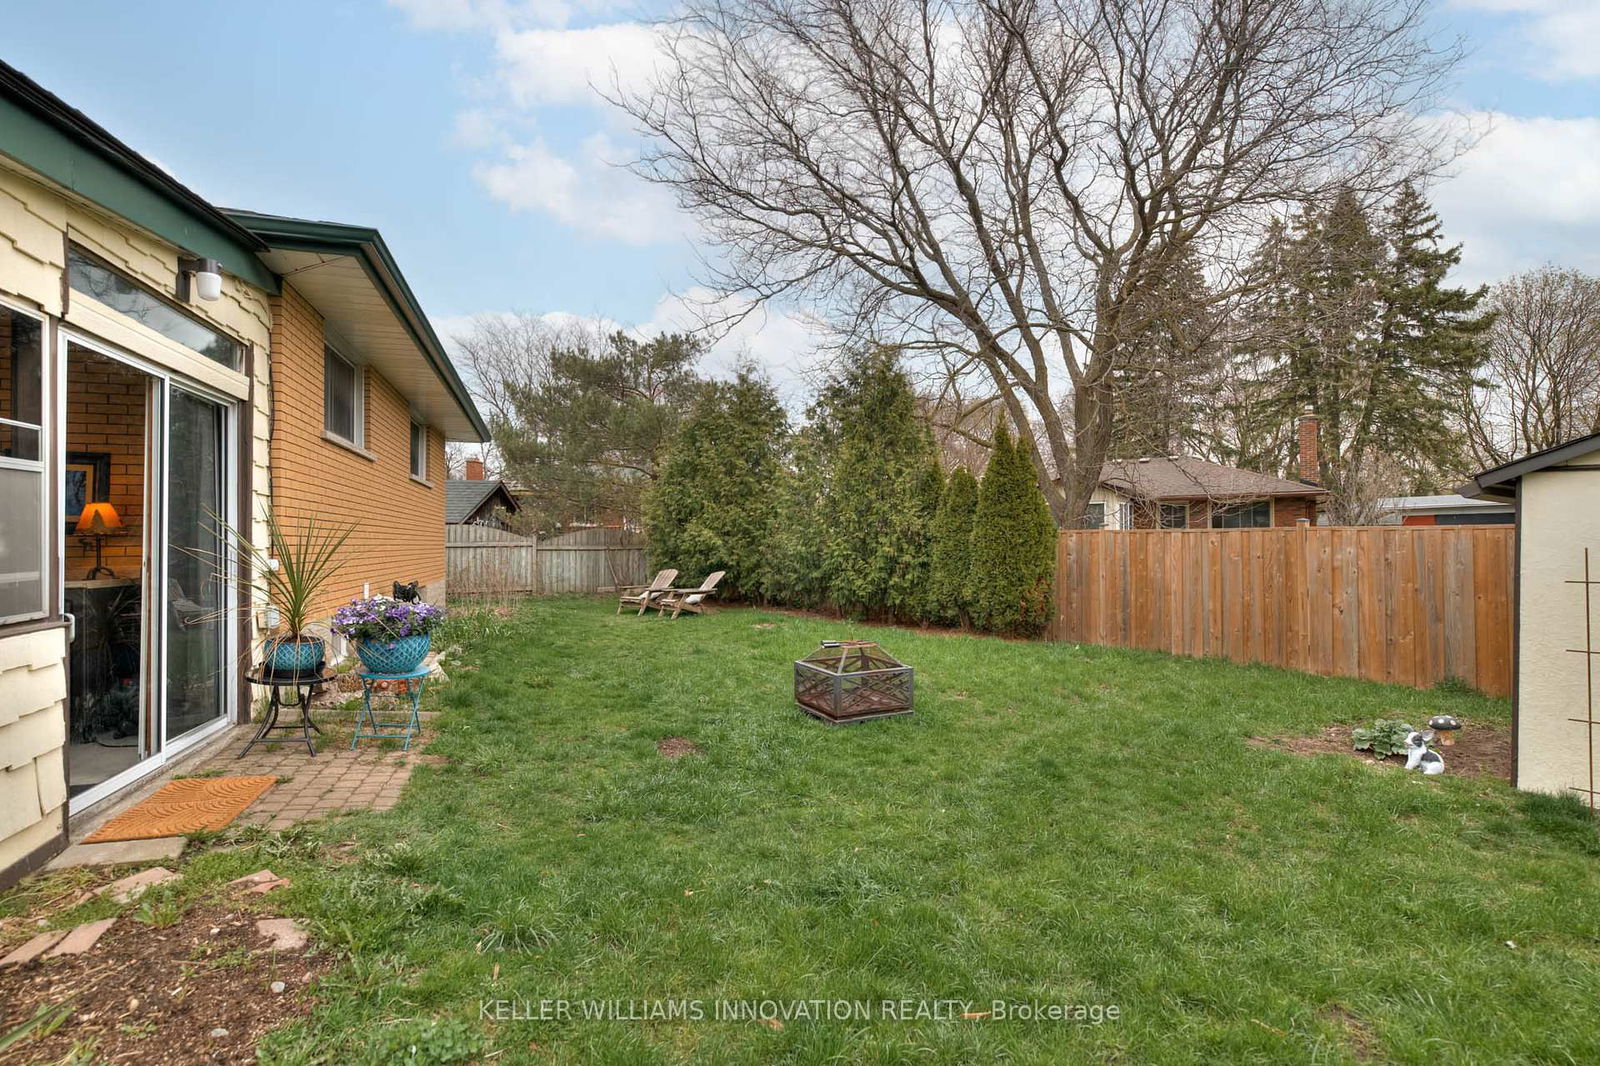
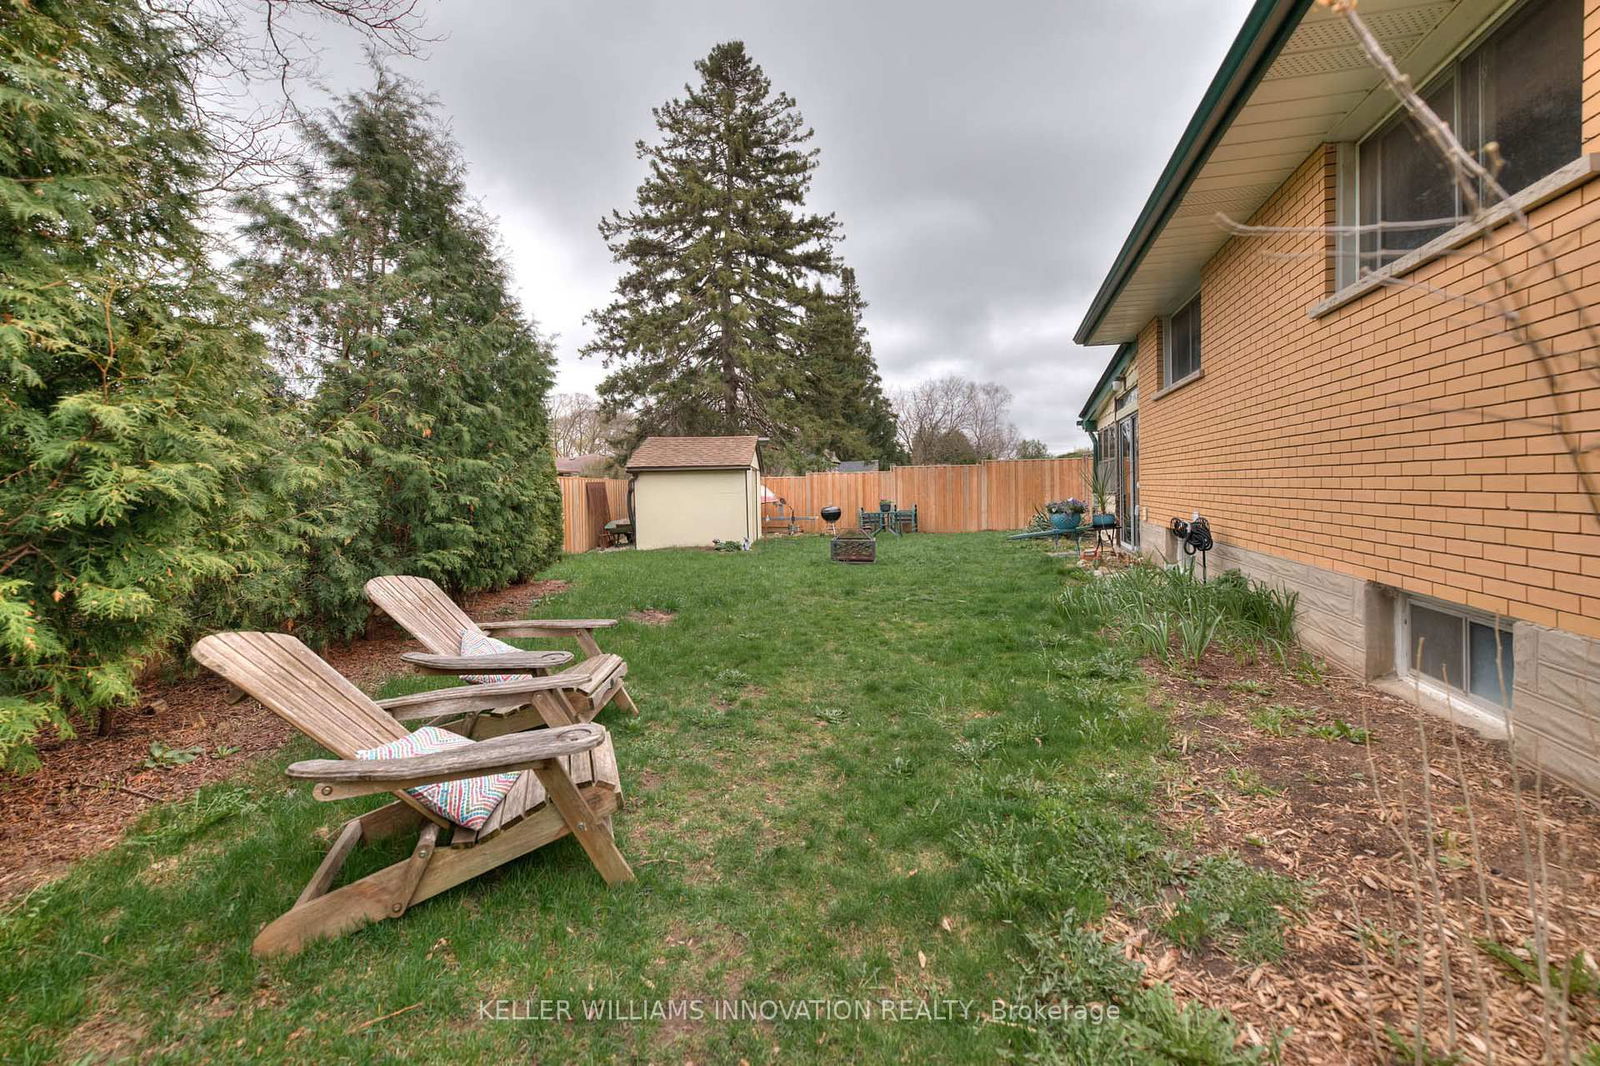
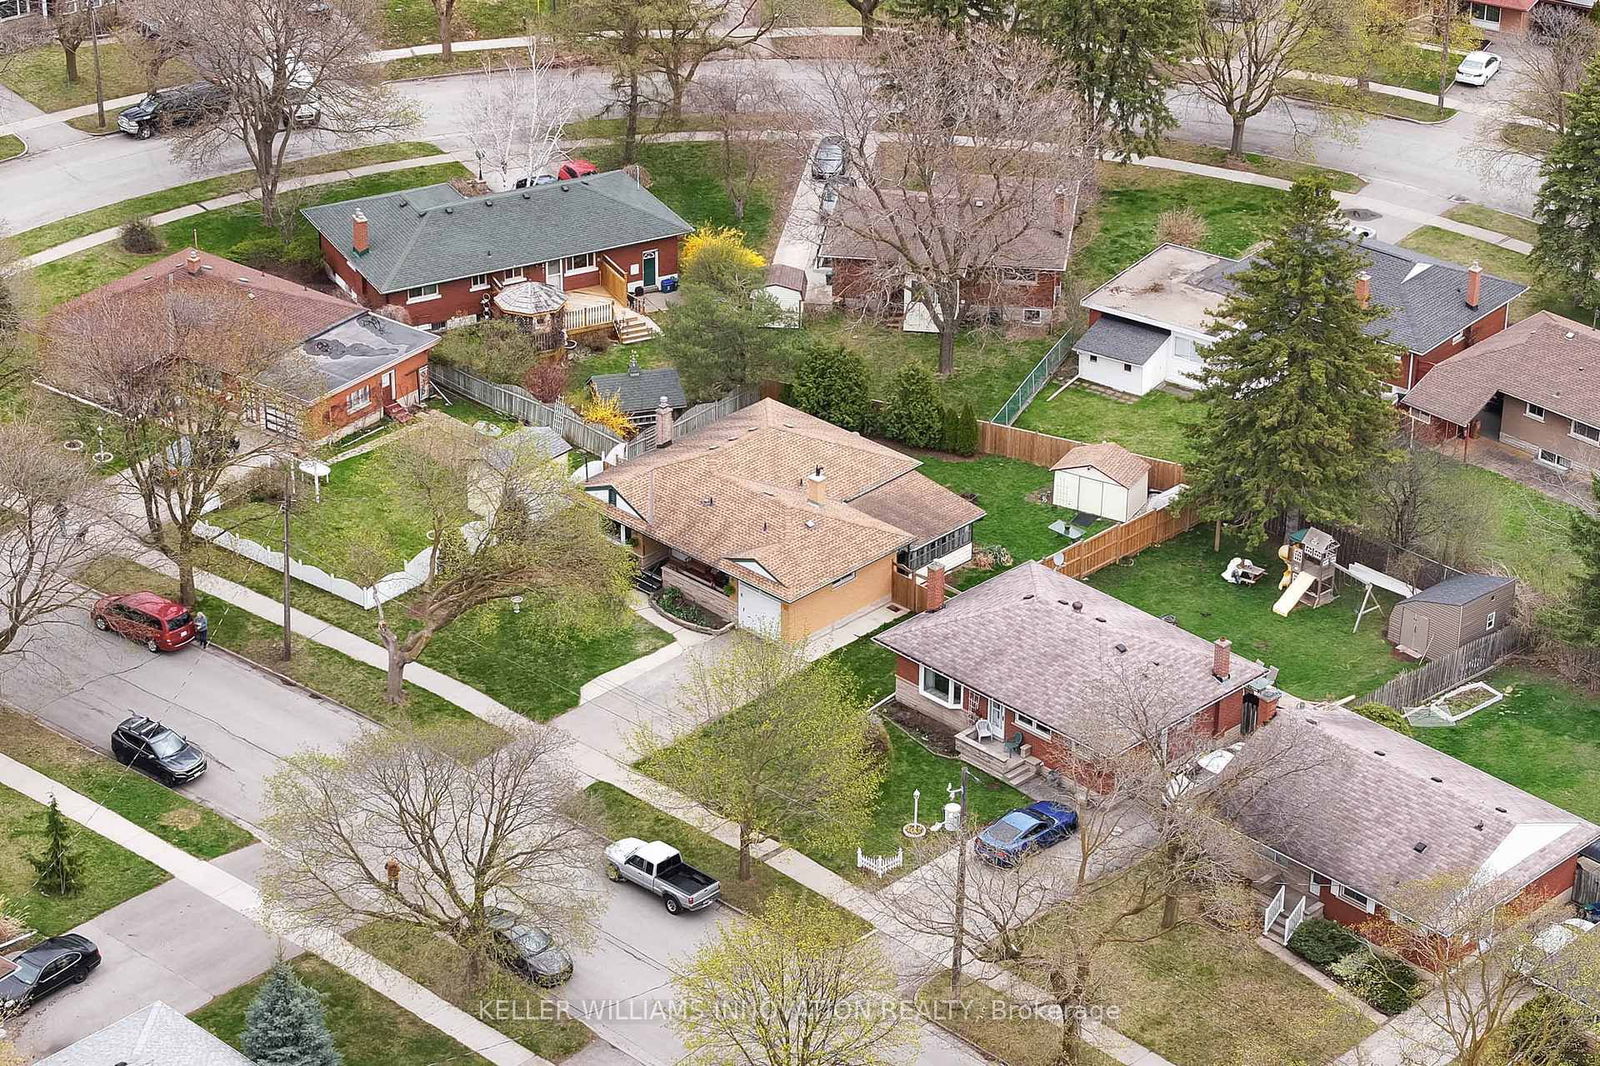
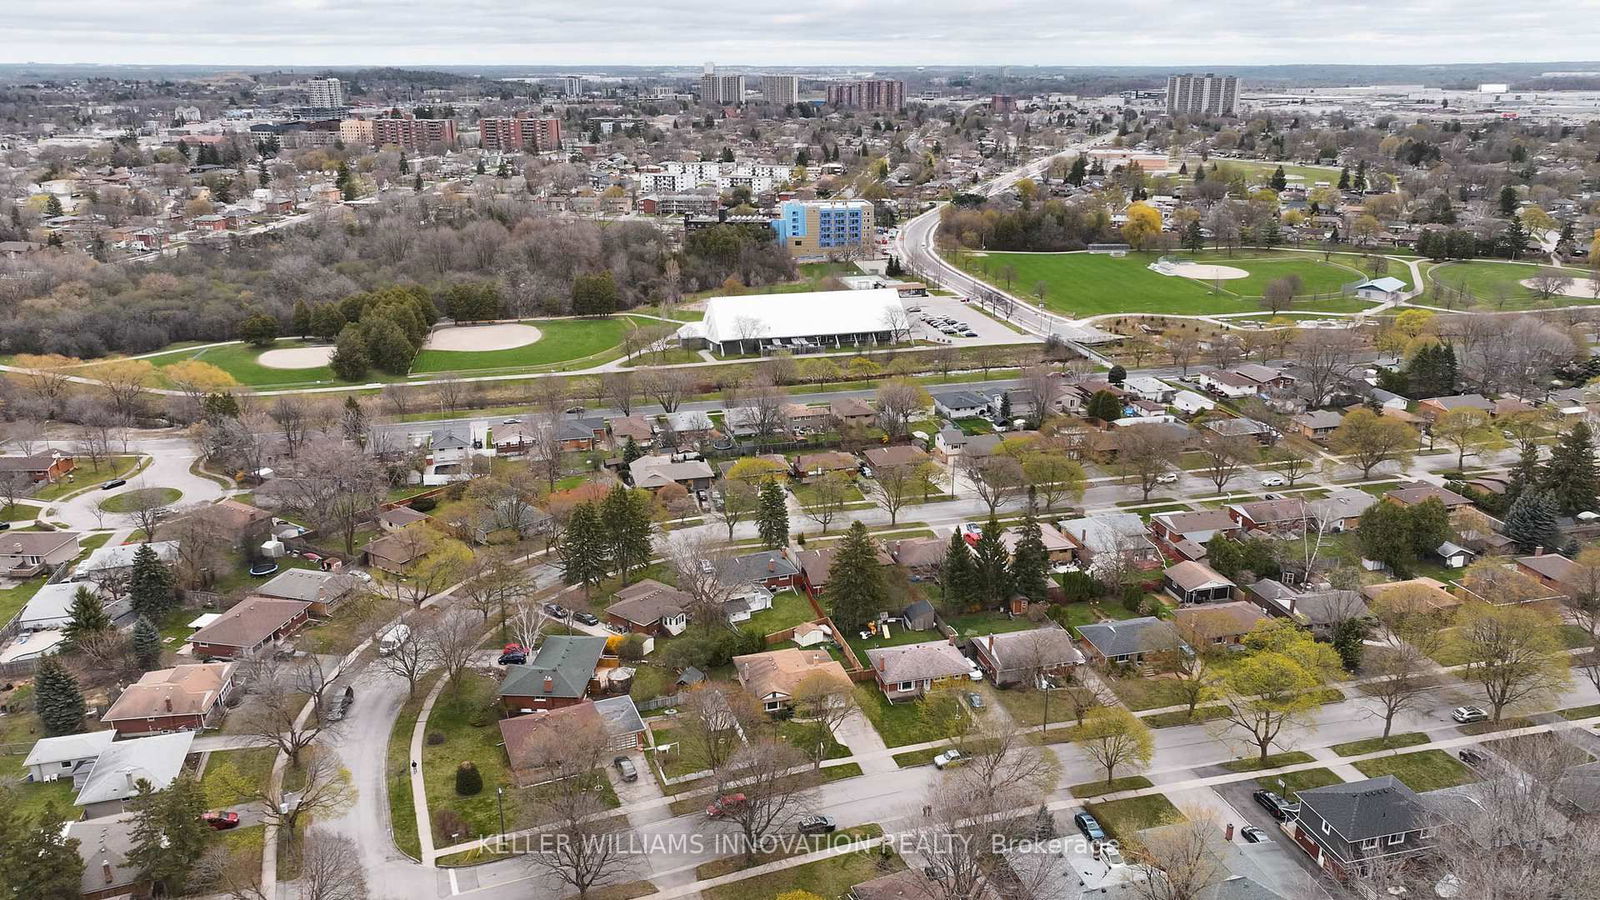
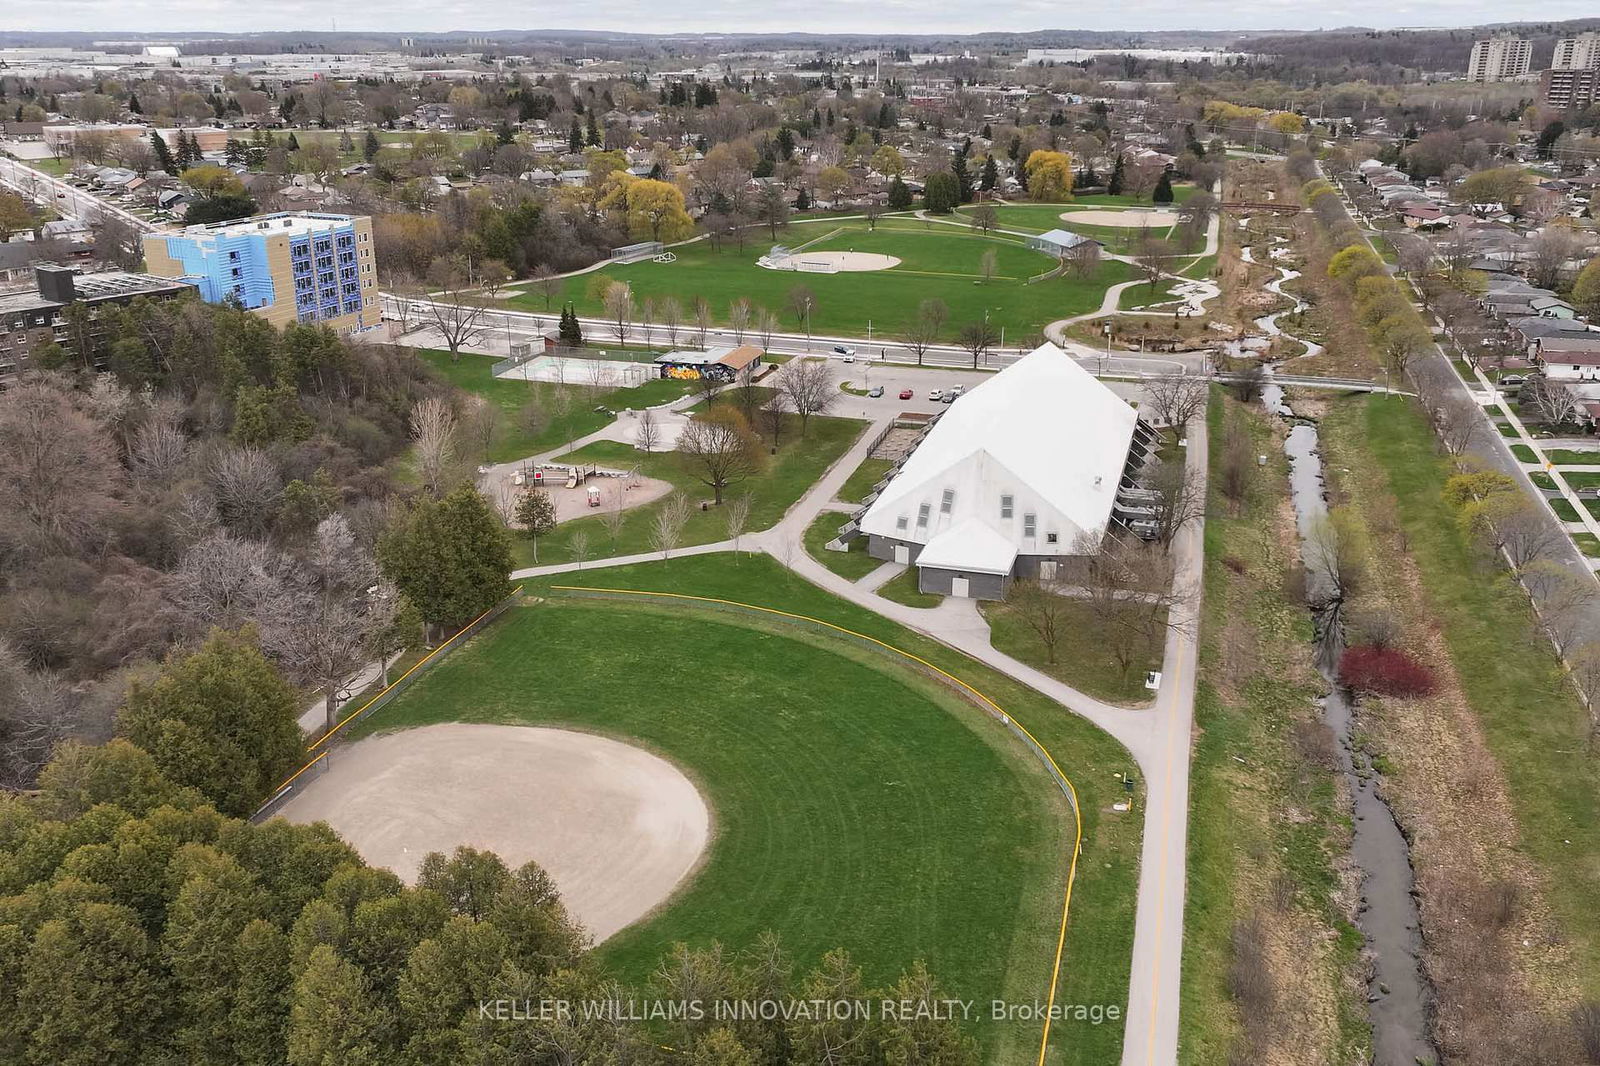
A beautiful home where the essence of warmth and comfort greets you upon entering through the front door. Spacious and cozy, it's designed for daily life, relaxation and entertainment. The living room sets the stage for family silliness and enjoyable gatherings, creating the perfect atmosphere for quality time together. The main level boasts three nicely sized bedrooms, a 4 piece bathroom and offers comfort and privacy. The kitchen layout provides ample storage space for creating delicious meals. Now, before heading down stairs, you'll want to make a stop into the sunroom. It's your future hangout spot; your retreat! Now, venture to the lower level to the finished basement, offering an additional degree of separation if needed. It's nicely suited for evening movie's, or games night! The furnace and A/C are new as of 2022, the water heater is owned(2020), ensuring peace of mind for years to come. Step outside to the backyard, there's a ton of greenspace for kids, dogs, or backyard parties. Situated in the sought-after Vanier/Kingsdale neighborhood, this home is only minutes away from FC Fairview shopping center, excellent schools, parks, public transit and quick highway access. Life is made easy in this beautiful home. It's well cared for and ready for its next chapter! Don't miss the opportunity to make 27 Massey Ave your new address book your showing today! UPDATES: Furnace - (2022); A/C - (2022); Hot Water Tank Owned - (2020); Kitchen Updated - (2020); Painting - (2025); Fenced Yard - (2019); Dishwasher - (2025); Freezer - (2019).
Carbon Monoxide Detector, Central Vac, Dishwasher, Dryer, Freezer, Garage Door Opener, Hot Water Tank Owned, Range Hood, Refrigerator, Stove, Washer, Window Coverings, Treadmill & Gas fireplace in basement.
Foyer
Living
Dining
Kitchen
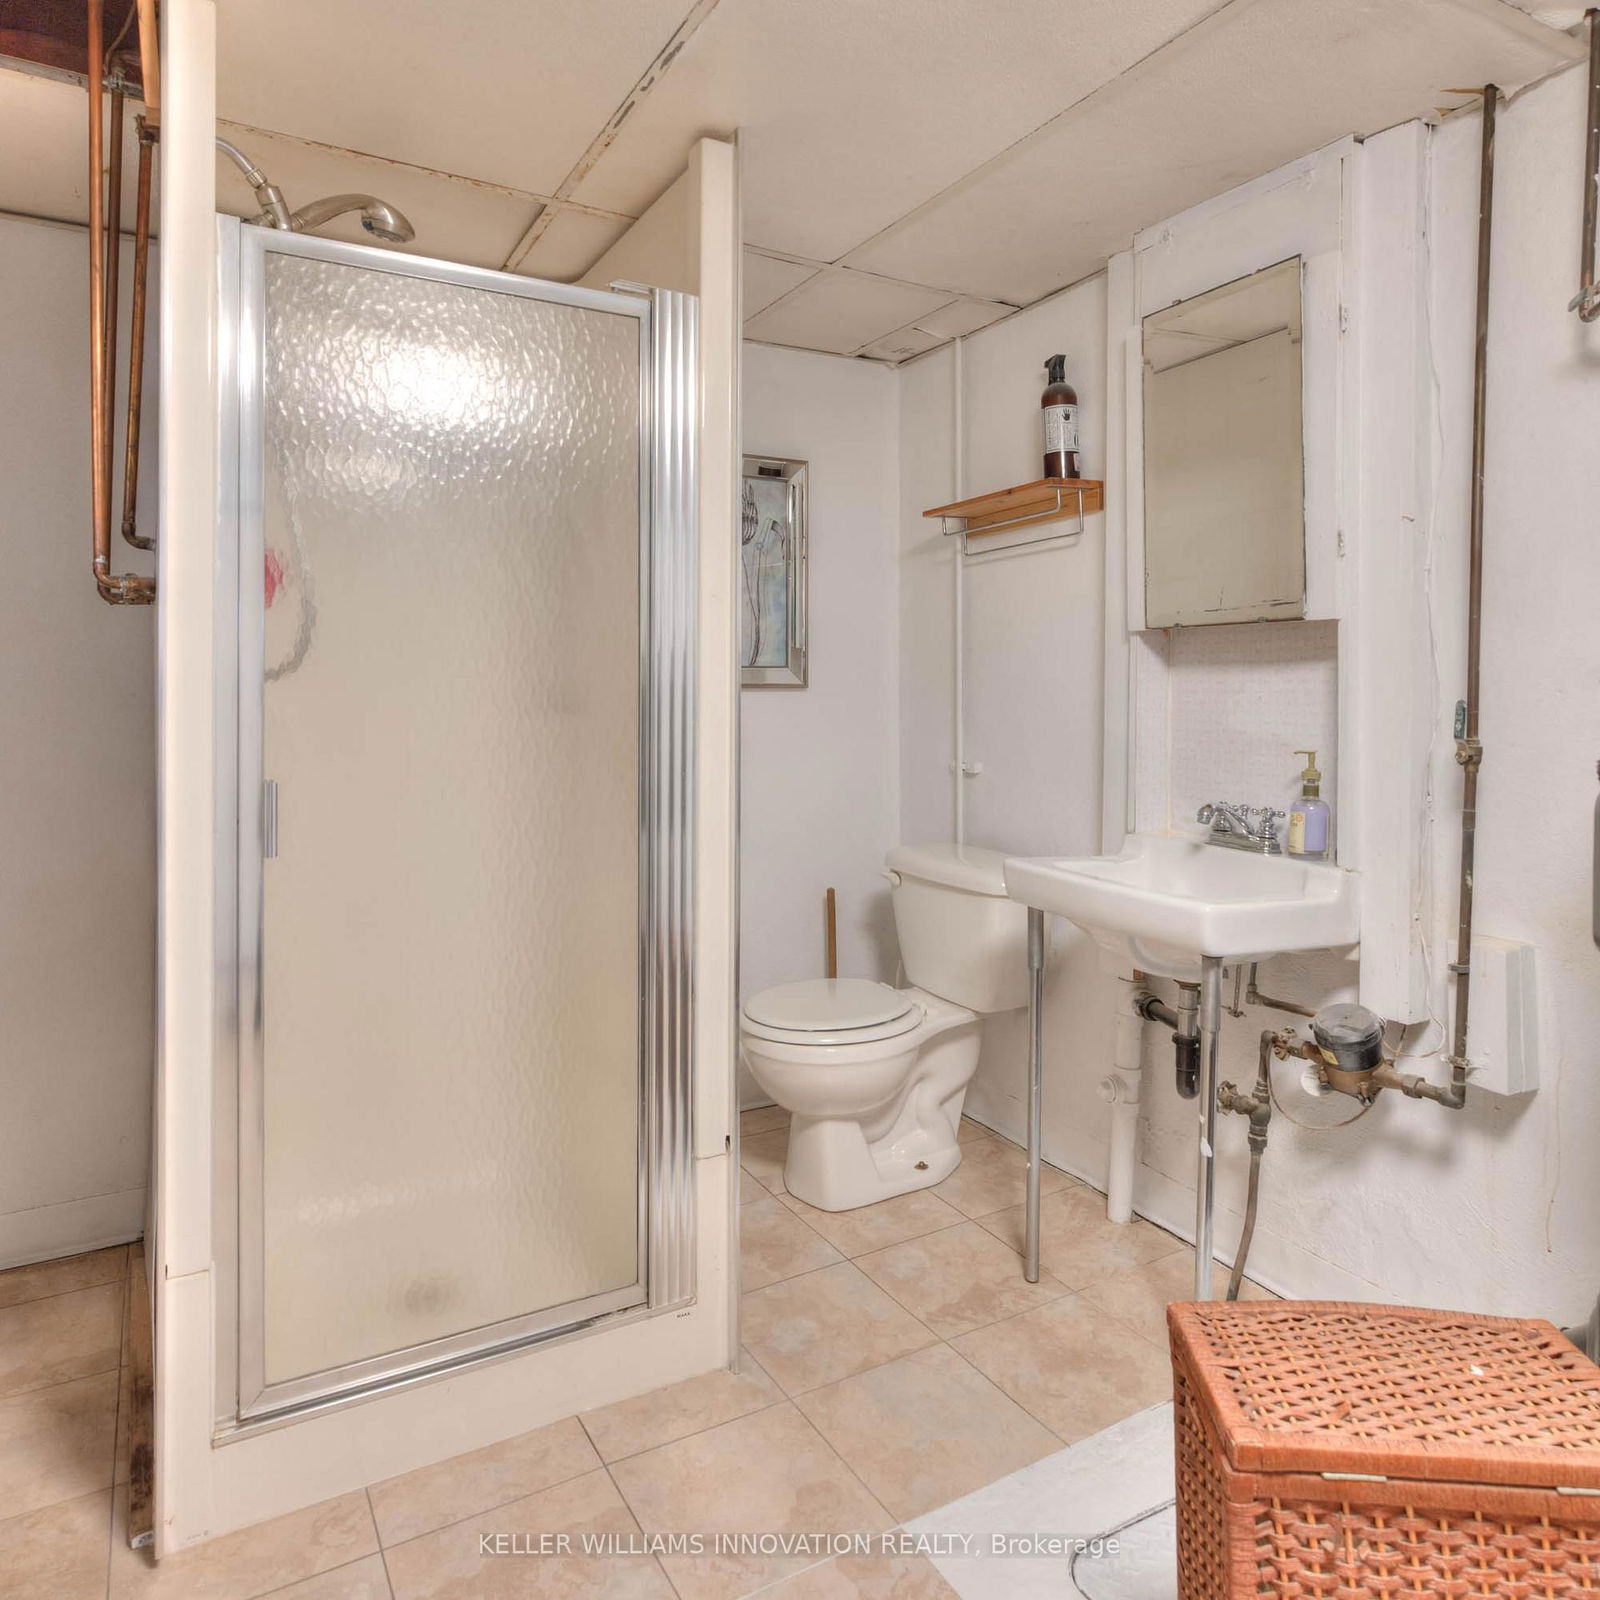
Bathroom
Primary
2nd Br
3rd Br
Sunroom
4th Br
Rec
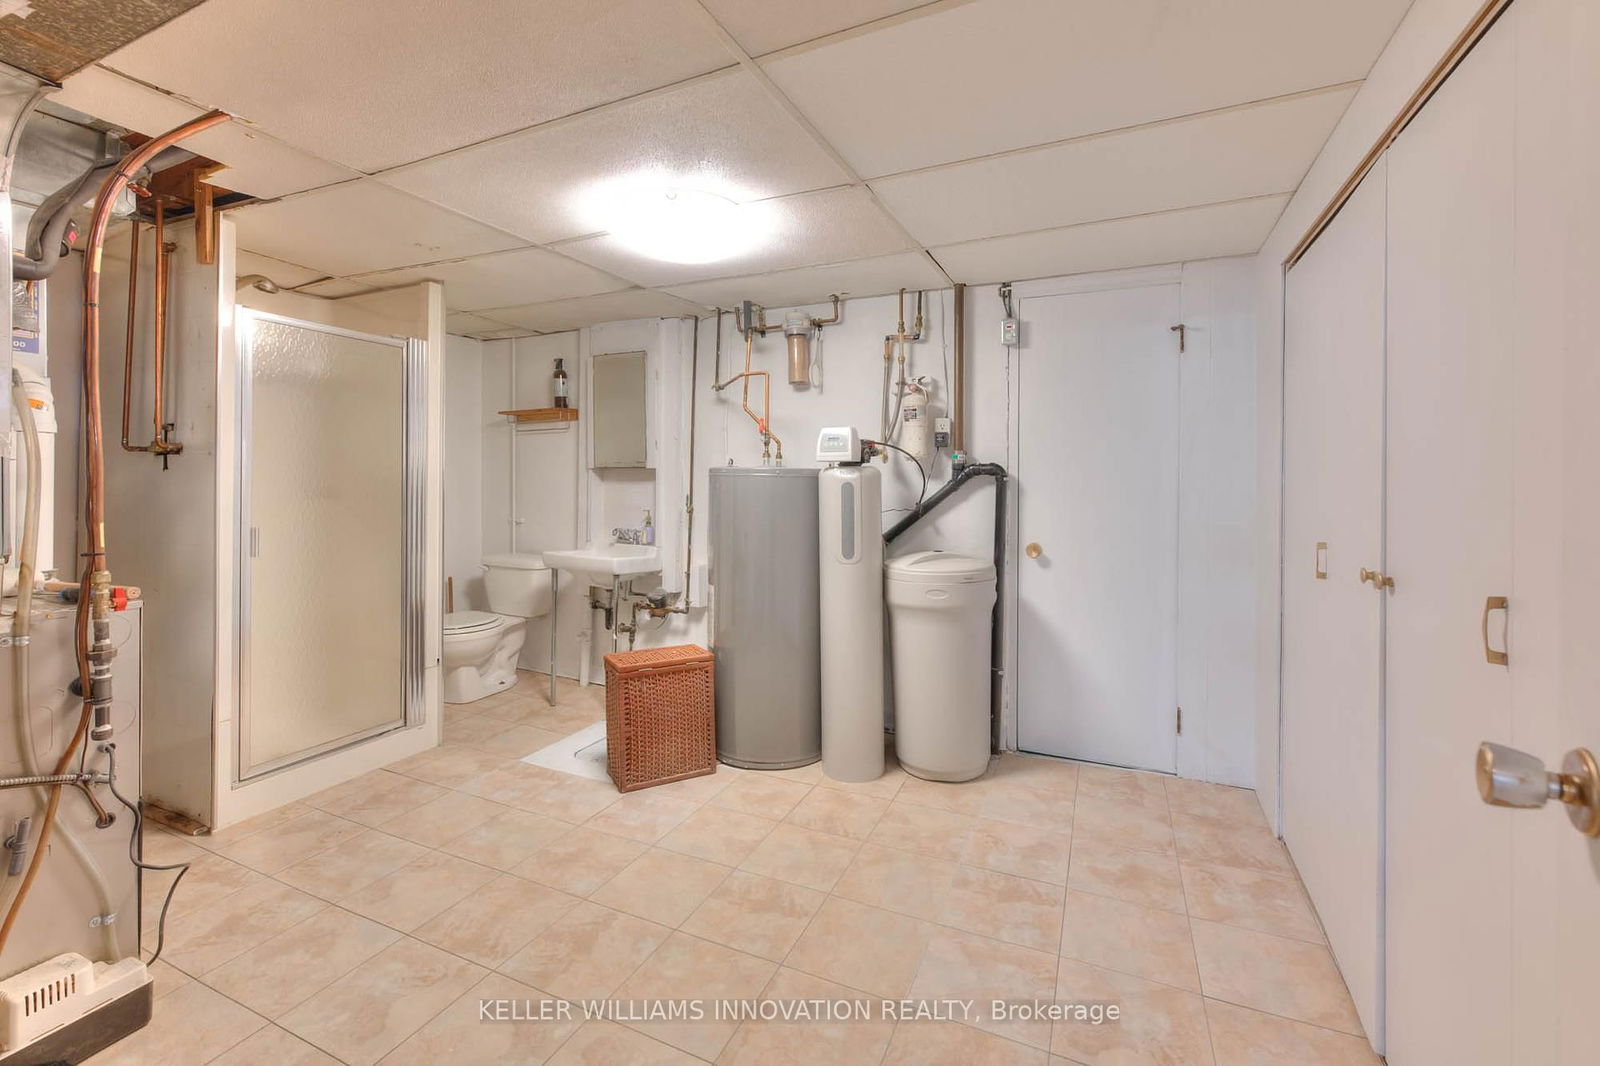
Utility
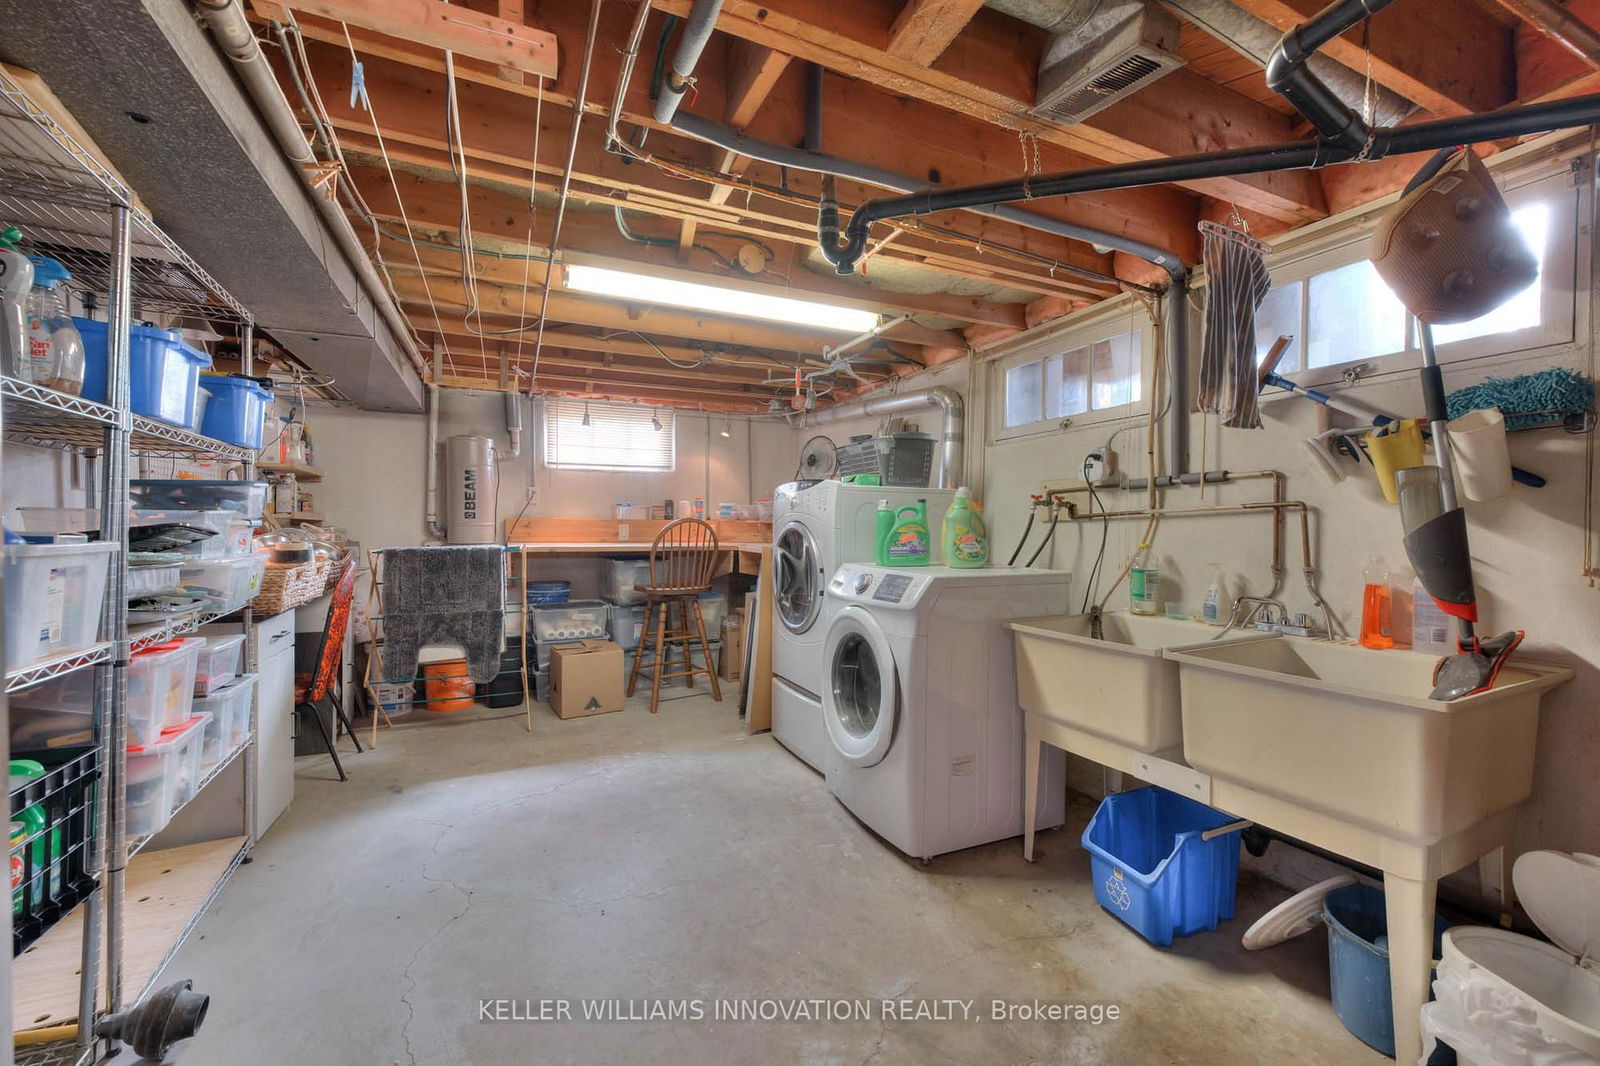
Laundry
Cold/Cant
The graph below compares the average list price and average sale price of homes in this neighborhood by month for the last 24 months. When average sale price is greater than average list price, this may suggest a buyer's market. When average sale price is lower than the average list price this may suggest a seller's market.
The graph below illustrates the average days on market for homes in this neighborhood. The yellow area may indicate a buyer's market, the green area may indicate a balanced market and the red area may indicate a seller's market.
Sales Representative, Century 21 People’s Choice Realty Inc., Brokerage
(647) 576 - 2100